Chapter 5 - Power and Electrical Transients
Chapter 5 of 7 | FPD.DEV | Development edition A-P15
Power and Electrical Transients
Input power, interruptions and recovery; Spikes, ripple and protection behaviour; Worked power and data-validity cases. Use the reading-page controls below the presentation for explanations and worked practice.
This chapter currently has an animated slide presentation and detailed reading. Recorded narration will be added in a future update.
Open chapter with slide navigation and reading-page controls | Download chapter slides PDF (12 pages)
Slide narration transcript
Slide 93: Power and Electrical Transients
FPD.DEV. The Future of Display and Systems Development. Welcome to Chapter 5, Power and Electrical Transients. This chapter follows the supply from the product input to the visible image and control outputs. We will examine interruptions, protection and ripple, then work through energy storage and recovery with current, valid information.
Slide 94: Aircraft power reaches the entire display
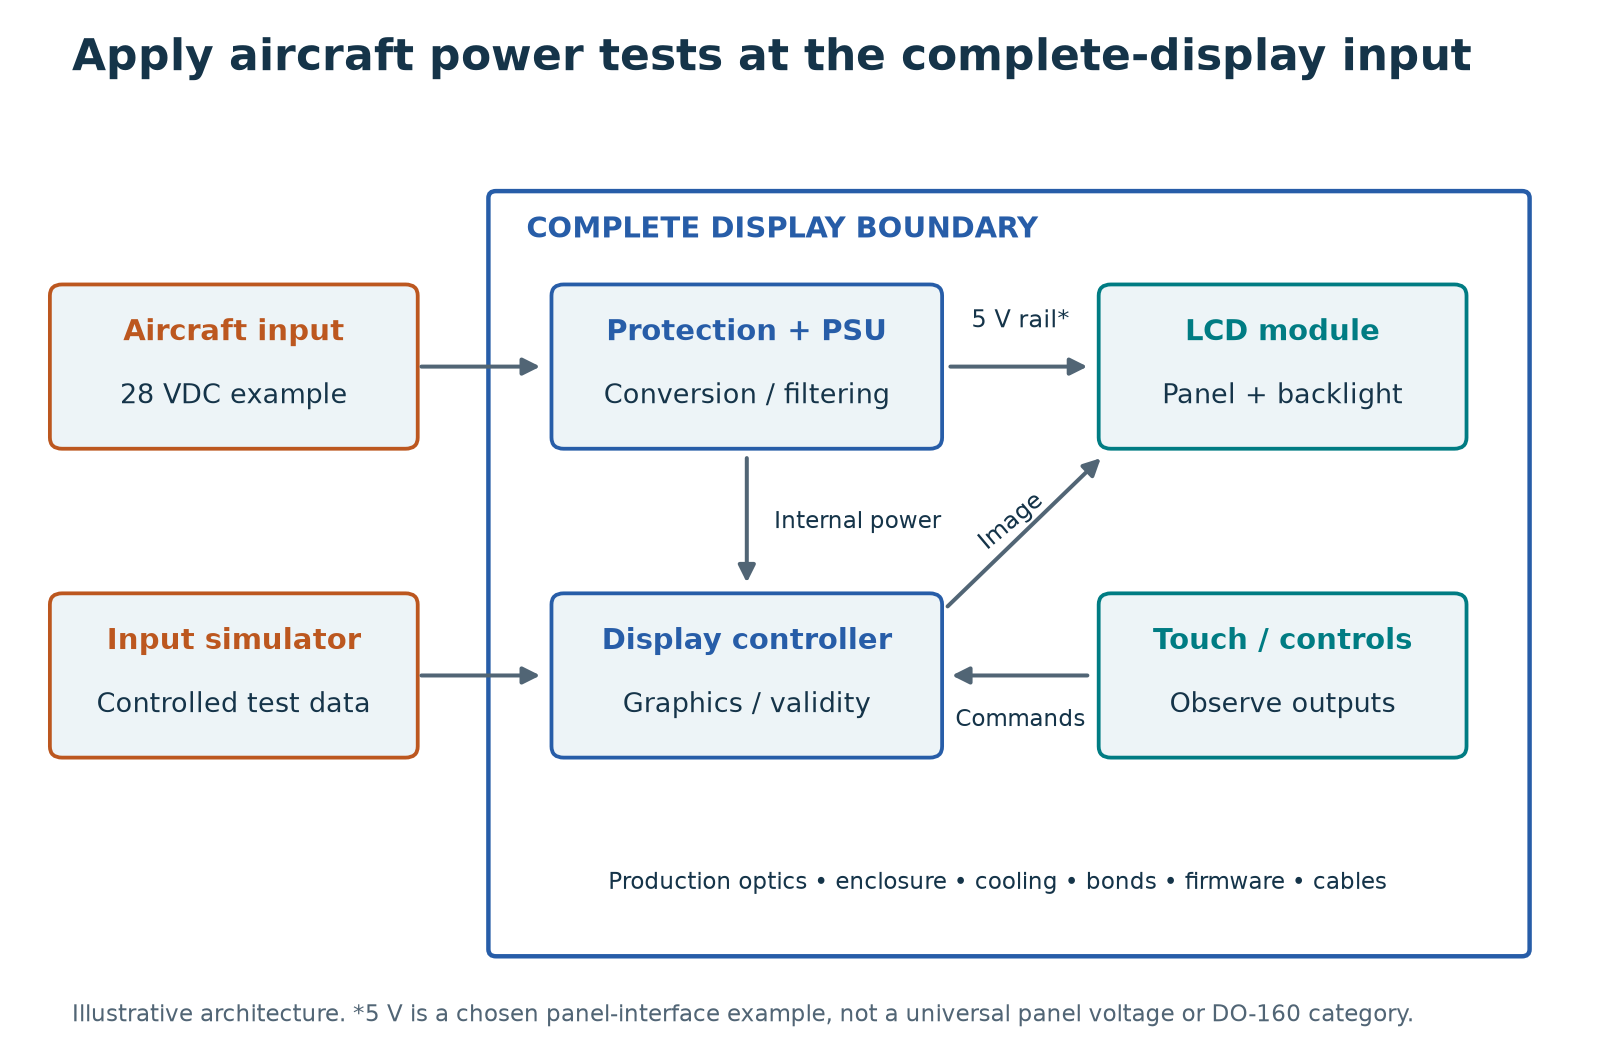
Follow the power path from the aircraft connector to the displayed image. A bare panel operating from a regulated five-volt bench supply does not exercise the aircraft-facing converter or protection. Section sixteen addresses power input, section seventeen voltage spikes, and section eighteen audio-frequency conducted susceptibility on power inputs. Audio frequency here describes an electrical disturbance, not loudspeaker sound. Test the allocated interfaces and modes, then observe resets, corrupted imagery, false controls, configuration retention and recovery against the agreed criteria.
Slide 95: Aircraft and vehicle power requirements
Military aircraft power requirements often invoke MIL-standard-seven-oh-four. The supporting handbook series provides test guidance. Compare the invoked characteristics with DO-one-sixty section sixteen and retain separately allocated electrical tests. Seven-oh-four excludes EMI and voltage spikes from its scope. A ground-vehicle derivative may instead need MIL-standard-twelve-seventy-five input-power characteristics. The shared twenty-eight-volt label does not make those interfaces equivalent. Compare disturbances at the display input terminals and observe the required operating and recovery behavior.
Slide 96: Power stimulus and electrical monitoring
The bench photograph shows an oscilloscope, a multimeter and a power supply. These instruments illustrate stimulus and electrical monitoring. A complete qualification setup also needs the specified disturbance source, sensing arrangement and measurement capability. Capture what reaches the display input and connect that trace to image behavior, resets, touch outputs and recovery. This photograph is general laboratory context. Its presence does not establish that the pictured bench meets a DO-one-sixty or military test procedure.
Slide 97: Power qualification at the display input
Begin at the input terminals of the product being qualified. Identify the applicable AC or DC supply and the category required for the installation. A display module supplied by a laboratory regulator is a different boundary from a complete unit containing its own aircraft power converter. Include the loads that can operate together, especially the backlight, heater and processing electronics. Cable impedance and current demand can change the waveform that reaches the unit, so verify the applied stimulus at the relevant measurement point. Use the connections and source conditions required by the adopted method. Preserve those details in the test record.
Slide 98: Interruptions, brownouts and restart
When supply voltage falls, the processor, backlight and interface circuits may stop at different times. A brief dark screen is one possible result, but a frozen image that appears valid can be more misleading. Define the required behaviour for the applicable interruption and voltage conditions before testing. Monitor internal rails where useful, the data link, visible image and any command output. Measure recovery from the specified reference point and verify that the displayed data is current. Also check retained settings and the restart state. The acceptance decision must address the complete required function rather than merely confirming that power eventually returns.
Slide 99: Hold-up energy: an initial estimate
For an initial estimate, suppose a twenty-watt load needs twenty milliseconds of hold-up while a capacitor falls from twenty-eight to eighteen volts. Equating load energy to the change in stored capacitor energy gives C equals two P t divided by the difference of the squared voltages. The ideal result is about one thousand seven hundred and forty microfarads. This excludes conversion loss, capacitor tolerance, ESR, ageing and the actual converter input limit. It also says nothing about recharge inrush. Use it to start the engineering analysis, then verify the real waveform and recovery behaviour with the selected power-input tests.
Slide 100: Voltage spikes and input protection
An input clamp limits voltage by diverting current, so its behaviour depends on the applied pulse, source impedance and physical current path. A protection component's catalogue rating alone does not describe the residual voltage at a downstream converter. Wiring inductance and layout can add voltage excursions. Follow the selected voltage-spike method and verify the applied stimulus as required. During development, measure the relevant protected node without allowing the probe arrangement to change the result. After the prescribed exposure, evaluate function and any latent change in the protection path. Keep this evidence separate from lightning transient qualification, which uses different methods and exposure definitions.
Slide 101: Audio-frequency ripple on power
Audio-frequency conducted susceptibility concerns interference imposed on the power input. A supply converter may reject some frequencies more effectively than others, and ripple can reach a backlight driver or a sensitive reference. Follow the selected section's injection and monitoring method rather than substituting arbitrary ripple from a bench supply. Exercise representative high-load and sensitive operating modes. Observe image modulation, touch events and communication errors while correlating them with the applied frequency and level. If a disturbance occurs, record its threshold and recovery as investigation data while retaining the required qualification result at the prescribed test conditions.
Slide 102: Heater and backlight load transitions
The highest average power mode is not automatically the most sensitive electrical mode. Cold start may combine heater demand with backlight start-up and processor initialization. A low-brightness mode can introduce a different switching pattern or make a small luminance fluctuation easier to see. Prepare a mode matrix showing the functions exercised, power demand and reason for selecting each case. Include credible simultaneous loads and transition states required by the product. Use development measurements to identify likely worst cases, then document the rationale for the formal test configuration. This prevents a convenient nominal mode from silently standing in for the full operating envelope.
Slide 103: Worked case: recovery with stale data
A display restarts within the example project's permitted recovery time, but its map position remains frozen for three seconds without an invalid-data indication. The power supply recovered, yet the end function has not necessarily met its requirement. Record input voltage, restart indication, received data timestamps and displayed updates on a common timeline. Review the requirement for data validity and annunciation, then classify the result accordingly. Possible corrections include interface restart handling or invalid-data indication, depending on the system design. The corrected unit needs the affected interruption and recovery checks again. A screenshot taken only after recovery would have missed the issue.
Slide 104: Chapter 5 complete
You have completed Power and Electrical Transients. Use the supporting reading pages to work through the examples and record the evidence you would need for your display. Next we continue with EMC, Lightning and ESD. FPD.DEV. The Future of Display and Systems Development.
Reading pages
Page 12: Aircraft power and display interfaces
Aircraft power and display interfaces
DO-160 Display Qualification | A-P13 — Development edition
Learning objective: Allocate Sections 16–18 to aircraft interfaces and internal display functions.
Trace power from connector to image
At the complete display boundary, the power connector, input protection, filter, converter, return paths, internal rails, processor, backlight and heater all affect the response. A regulated panel supply on a component bench does not exercise this chain. For a split display/controller architecture, identify each powered unit and the representative interconnections.
Section 16 addresses power input characteristics and disturbances for the selected supply/category. Section 17 addresses voltage spikes. Section 18 addresses audio-frequency conducted susceptibility on power inputs. These are different exposure families; passing one is not evidence for every disturbance on the aircraft bus.
Select exact voltage/frequency categories, waveforms, source conditions, durations and interface arrangements from the adopted standard and aircraft specification. Nominal 28 VDC is an architecture description, not a complete transient envelope. Do not substitute a familiar automotive load-dump waveform for an allocated aircraft test without a documented requirement comparison.
Mode selection
Maximum brightness may maximize load, but a dimming mode may produce a different current spectrum. Include startup, permitted heater/backlight combinations, graphics load, cooling and any redundant-power transfers. Define which failures require uninterrupted display function and where a specified recovery is permitted. Measure power at the relevant equipment terminals, accounting for test harness effects.
Observe function and state
Monitor dynamic imagery, validity indications, input processing, touch/control output, resets, configuration retention and required recovery time. Record input waveforms and output events on a common time base when necessary. A brief image blank followed by recovery must be evaluated against the actual requirement, not treated automatically as acceptable.
Worked investigation
The external input remains within its prescribed test waveform, but the internal 5 V rail dips and the display reboots. The cause may be the converter, protection thresholds, wiring impedance, load transient or power sequencing. Diagnose the complete path. If firmware changes the recovery behavior, assess the affected qualification and functional evidence before retesting.
Contract output
State the supply architecture and category, each applicable subtest, test point, load/mode, monitoring resolution, permitted interruption and recovery, protection behavior and retained data. Include how test-support equipment is isolated so its grounding does not unintentionally bypass the production return or filter.
Connection to the standards map
Compare DO-160 Section 16 with any invoked MIL-STD-704 aircraft-power requirement. For military ground vehicles, evaluate MIL-STD-1275 separately. Use the standards-applicability worksheet on Page 04 in Chapter 1.
Page takeaway
- Trace each aircraft-facing input through protection and conversion to the image and controls.
Supporting page images
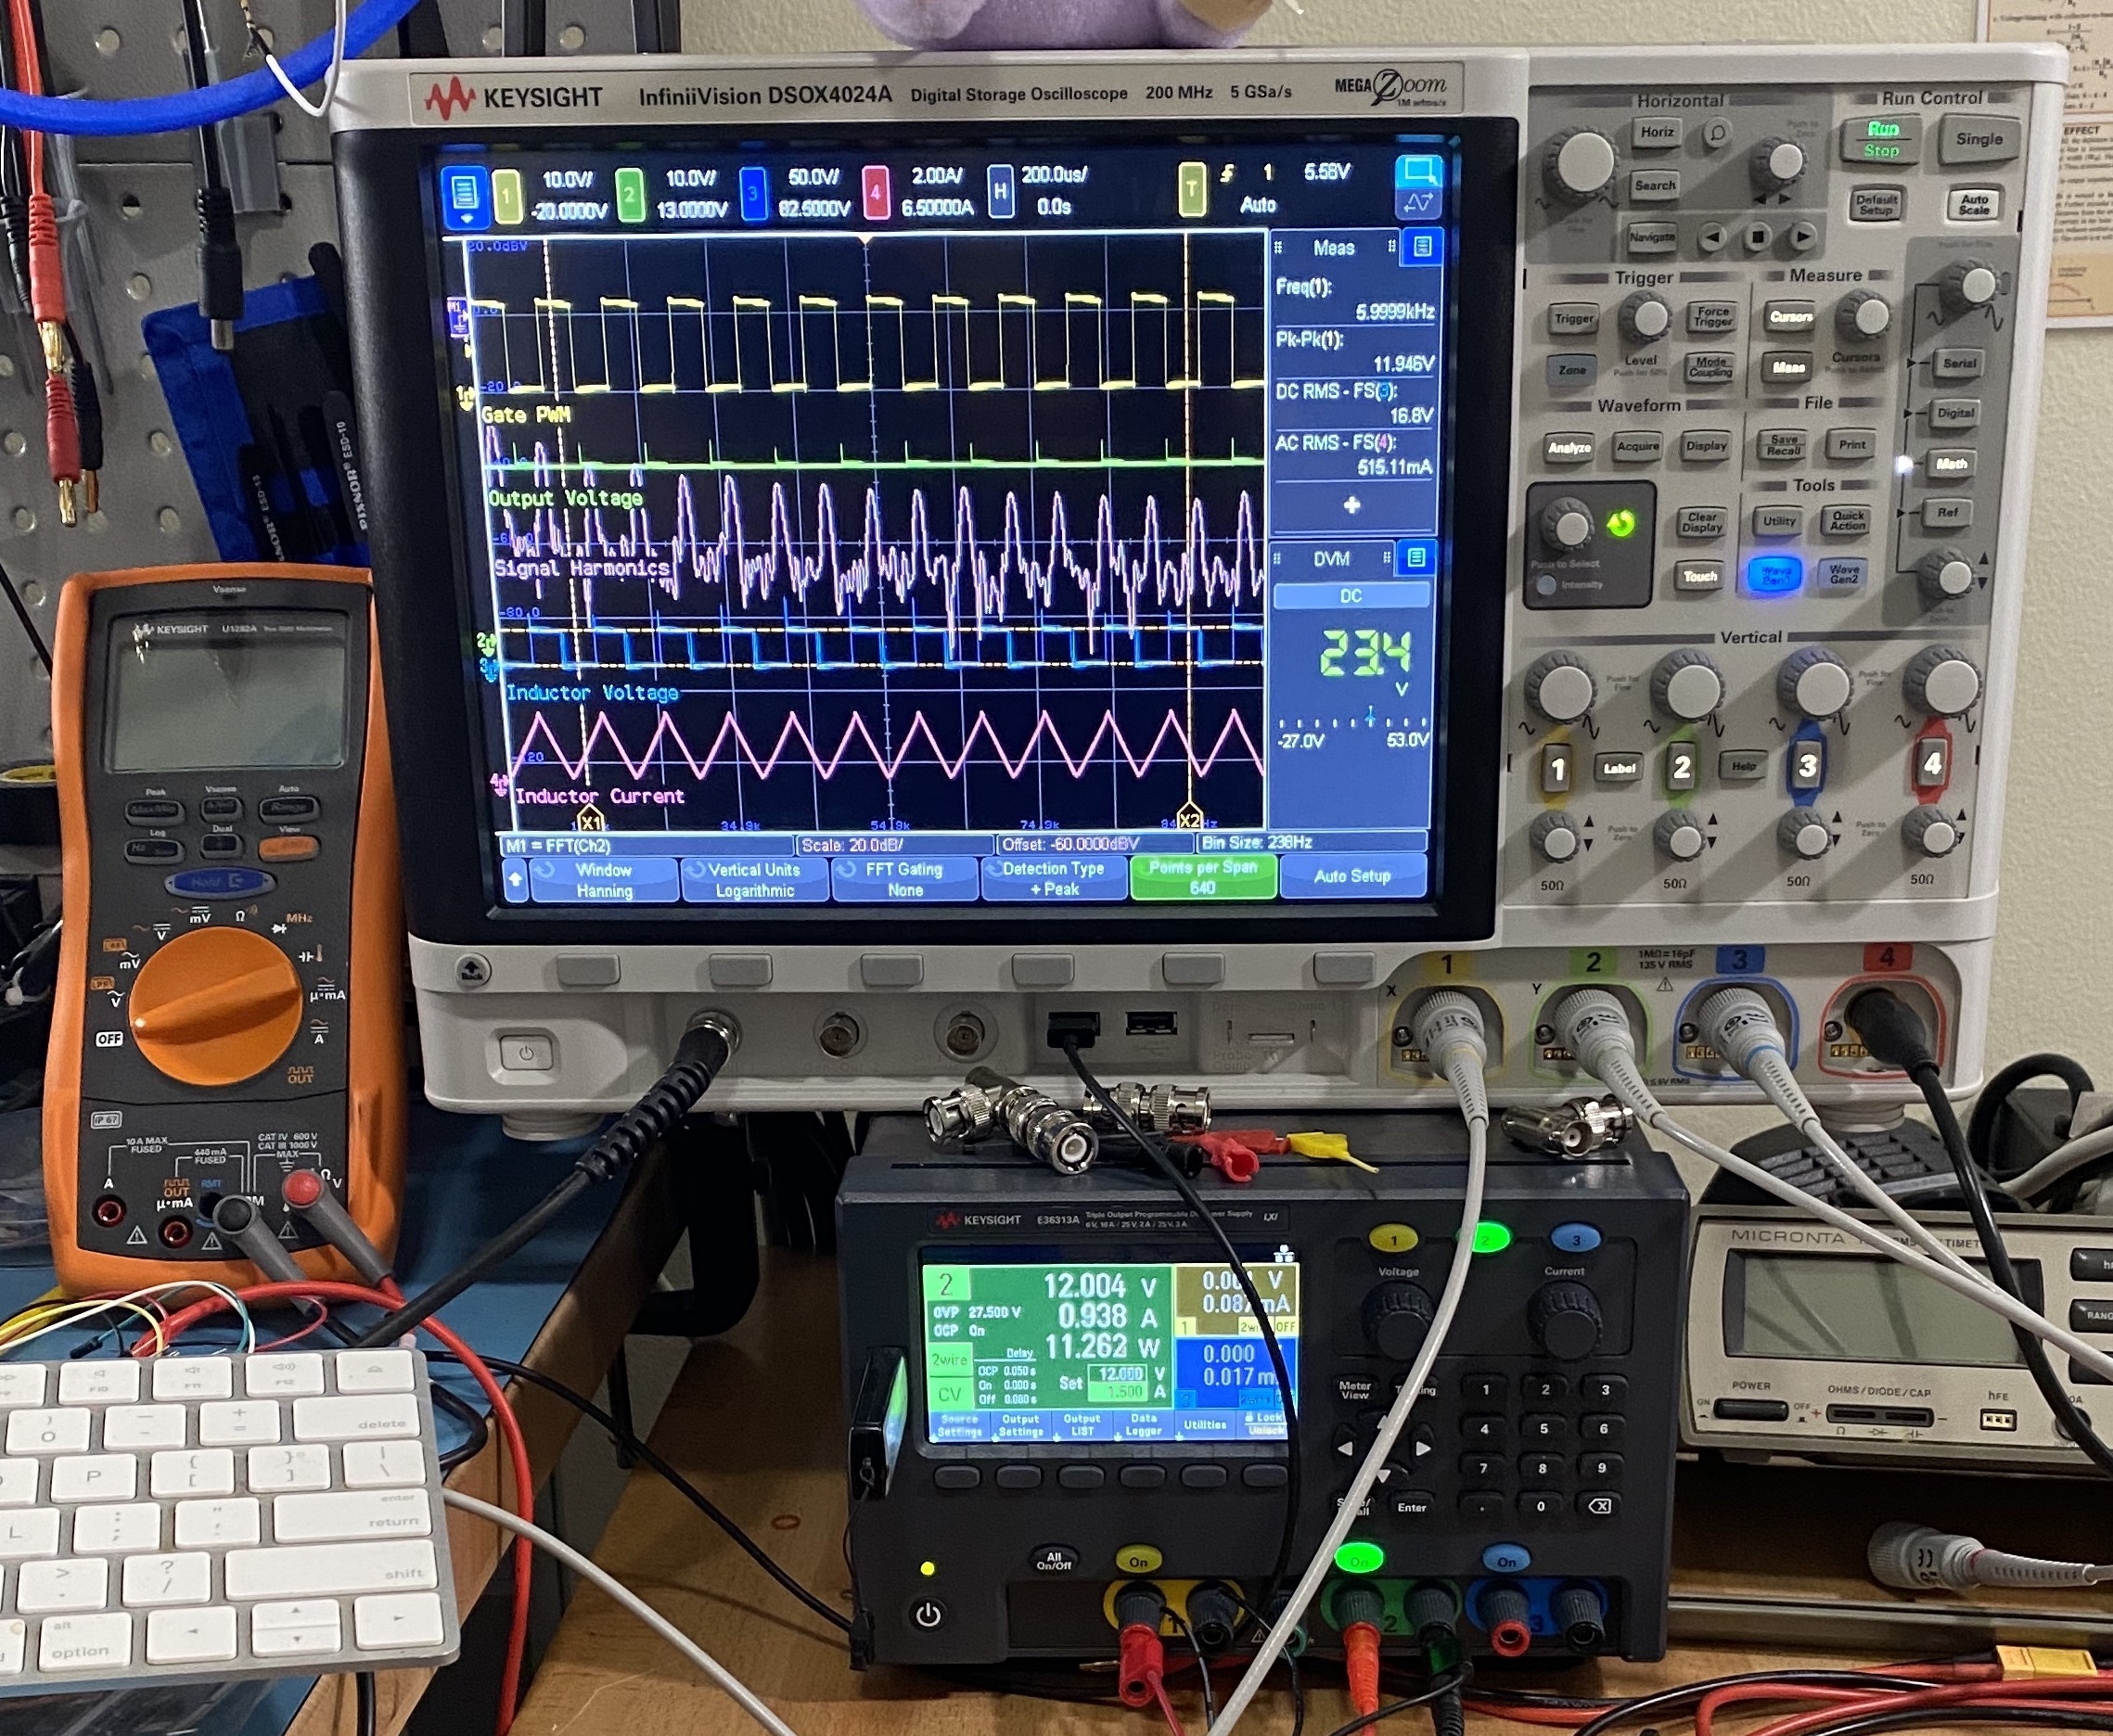
Image: Radarvector; source crop by Pittigrilli · Keysight InfiniiVision DSOX 4024A and digital multimeter and power supply in laboratory use · CC BY-SA 4.0. Existing source crop by Pittigrilli retained; no further image edits. Displayed at reduced size.

Engineering application and worked evidence
The following examples develop the display mechanisms and evidence decisions. Numerical values are teaching assumptions, not universal DO-160 limits. Use the adopted procedure for exact test conditions and the product requirements for functional acceptance.
Power qualification at the display input
Begin at the input terminals of the product being qualified. Identify the applicable AC or DC supply and the category required for the installation. A display module supplied by a laboratory regulator is a different boundary from a complete unit containing its own aircraft power converter. Include the loads that can operate together, especially the backlight, heater and processing electronics. Cable impedance and current demand can change the waveform that reaches the unit, so verify the applied stimulus at the relevant measurement point. Use the connections and source conditions required by the adopted method. Preserve those details in the test record.
Basis: RTCA DO-160G, Sections 3 and 16. Retained reference in 80 Reference Library/Aerospace. Display mechanisms, design responses and worked cases are FPD.DEV engineering teaching synthesis, not additional DO-160 requirements. Numerical examples are illustrative.
Interruptions, brownouts and restart
When supply voltage falls, the processor, backlight and interface circuits may stop at different times. A brief dark screen is one possible result, but a frozen image that appears valid can be more misleading. Define the required behaviour for the applicable interruption and voltage conditions before testing. Monitor internal rails where useful, the data link, visible image and any command output. Measure recovery from the specified reference point and verify that the displayed data is current. Also check retained settings and the restart state. The acceptance decision must address the complete required function rather than merely confirming that power eventually returns.
Basis: RTCA DO-160G, Section 16; FAA AC 25-11B display guidance. Retained reference in 80 Reference Library/Aerospace. Display mechanisms, design responses and worked cases are FPD.DEV engineering teaching synthesis, not additional DO-160 requirements. Numerical examples are illustrative.
Hold-up energy: an initial estimate
For an initial estimate, suppose a twenty-watt load needs twenty milliseconds of hold-up while a capacitor falls from twenty-eight to eighteen volts. Equating load energy to the change in stored capacitor energy gives C equals two P t divided by the difference of the squared voltages. The ideal result is about one thousand seven hundred and forty microfarads. This excludes conversion loss, capacitor tolerance, ESR, ageing and the actual converter input limit. It also says nothing about recharge inrush. Use it to start the engineering analysis, then verify the real waveform and recovery behaviour with the selected power-input tests.
| Assumption | Value | Calculation |
|---|---|---|
| Load and duration | 20 W, 0.020 s | Energy = 0.40 J |
| Voltage window | 28 V to 18 V | 28² − 18² = 460 V² |
| Ideal capacitance | 0.80 / 460 F | About 1,740 µF |
Basis: RTCA DO-160G, Section 16; elementary capacitor energy calculation. Retained reference in 80 Reference Library/Aerospace. Display mechanisms, design responses and worked cases are FPD.DEV engineering teaching synthesis, not additional DO-160 requirements. Numerical examples are illustrative.
Voltage spikes and input protection
An input clamp limits voltage by diverting current, so its behaviour depends on the applied pulse, source impedance and physical current path. A protection component's catalogue rating alone does not describe the residual voltage at a downstream converter. Wiring inductance and layout can add voltage excursions. Follow the selected voltage-spike method and verify the applied stimulus as required. During development, measure the relevant protected node without allowing the probe arrangement to change the result. After the prescribed exposure, evaluate function and any latent change in the protection path. Keep this evidence separate from lightning transient qualification, which uses different methods and exposure definitions.
Basis: RTCA DO-160G, Sections 17 and 22. Retained reference in 80 Reference Library/Aerospace. Display mechanisms, design responses and worked cases are FPD.DEV engineering teaching synthesis, not additional DO-160 requirements. Numerical examples are illustrative.
Audio-frequency ripple on power
Audio-frequency conducted susceptibility concerns interference imposed on the power input. A supply converter may reject some frequencies more effectively than others, and ripple can reach a backlight driver or a sensitive reference. Follow the selected section's injection and monitoring method rather than substituting arbitrary ripple from a bench supply. Exercise representative high-load and sensitive operating modes. Observe image modulation, touch events and communication errors while correlating them with the applied frequency and level. If a disturbance occurs, record its threshold and recovery as investigation data while retaining the required qualification result at the prescribed test conditions.
Basis: RTCA DO-160G, Section 18. Retained reference in 80 Reference Library/Aerospace. Display mechanisms, design responses and worked cases are FPD.DEV engineering teaching synthesis, not additional DO-160 requirements. Numerical examples are illustrative.
Heater and backlight load transitions
The highest average power mode is not automatically the most sensitive electrical mode. Cold start may combine heater demand with backlight start-up and processor initialization. A low-brightness mode can introduce a different switching pattern or make a small luminance fluctuation easier to see. Prepare a mode matrix showing the functions exercised, power demand and reason for selecting each case. Include credible simultaneous loads and transition states required by the product. Use development measurements to identify likely worst cases, then document the rationale for the formal test configuration. This prevents a convenient nominal mode from silently standing in for the full operating envelope.
Basis: RTCA DO-160G, Sections 4, 16, 18, 20 and 21. Retained reference in 80 Reference Library/Aerospace. Display mechanisms, design responses and worked cases are FPD.DEV engineering teaching synthesis, not additional DO-160 requirements. Numerical examples are illustrative.
Worked case: recovery with stale data
A display restarts within the example project's permitted recovery time, but its map position remains frozen for three seconds without an invalid-data indication. The power supply recovered, yet the end function has not necessarily met its requirement. Record input voltage, restart indication, received data timestamps and displayed updates on a common timeline. Review the requirement for data validity and annunciation, then classify the result accordingly. Possible corrections include interface restart handling or invalid-data indication, depending on the system design. The corrected unit needs the affected interruption and recovery checks again. A screenshot taken only after recovery would have missed the issue.
| Event | Evidence | Acceptance question |
|---|---|---|
| Power returns | Input and rail trace | Electrical recovery? |
| Image returns | Timed video | Required recovery time? |
| Map stays frozen | Data and display log | Valid current information? |
Basis: RTCA DO-160G, Section 16; FAA AC 25-11B; authored case. Retained reference in 80 Reference Library/Aerospace. Display mechanisms, design responses and worked cases are FPD.DEV engineering teaching synthesis, not additional DO-160 requirements. Numerical examples are illustrative.
Practice: Power recovery and energy storage
Repeat the ideal hold-up estimate for a 30 W load for 20 ms over a 28 V to 18 V capacitor window. Then explain why that result cannot specify the final capacitor or prove recovery.
Model response and review points
C = 2Pt/(Vhigh² − Vlow²) = 1.2/460 F, approximately 2,609 µF. The estimate excludes converter losses, capacitor tolerance and ageing, ESR, temperature behaviour and actual undervoltage thresholds. Recharge inrush also needs assessment. Qualification must measure the applied waveform and the required image, valid data and command behaviour during interruption and recovery. A capacitor calculation does not establish those end functions.
References and sources
- FAA AC 21-16G, §§4 and 7: DO-160 environmental qualification and regulatory context
- MIL-STD-461, scope and invoked test methods: Equipment EMI
- MIL-STD-464, scope: System E3
- MIL-STD-704 and MIL-HDBK-704 series, scope: Aircraft power
- MIL-STD-1275, scope: Military ground-vehicle power
- www.rtca.org: RTCA DO-160 publications and supporting material
- www.faa.gov: FAA AC 20-158B
- www.faa.gov: FAA AC 20-136C
This course is a living document. Enrolled learners typically receive updates when chapters are revised. Use your project’s adopted standards and qualification baseline.
Il n'y a aucune réaction pour le moment.
pour être le premier à laisser un commentaire.