High Ambient Contrast Ratio: Why Display Brightness Alone Does Not Guarantee Sunlight Readability

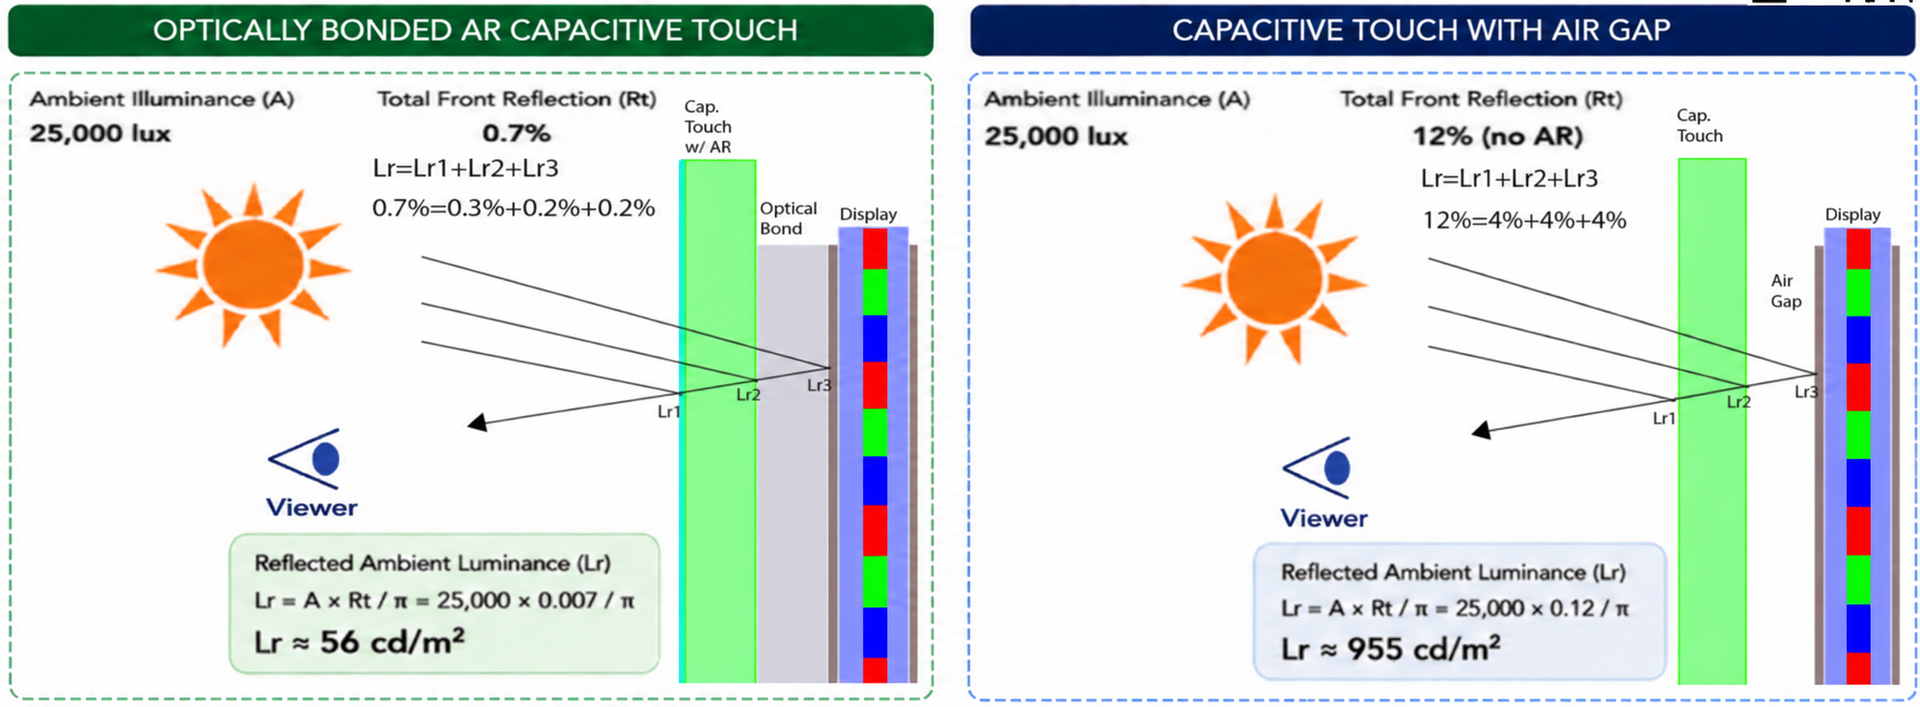
Display brightness is often the first specification people look at when choosing a display for outdoor, aviation, marine, industrial, medical, or military applications. A high-brightness LCD or OLED may look impressive on a datasheet, but brightness alone does not determine whether a display will remain readable in the real world.
In high ambient light, the bigger issue is often not how much light the display produces. The bigger issue is how much ambient light the front of the display reflects back toward the viewer.
That is where High Ambient Contrast Ratio, or HACR, becomes important.
What Is HACR?
High Ambient Contrast Ratio is the effective contrast ratio of a display in the brightest environment where it needs to operate.
Dark-room contrast is measured under controlled conditions with little or no ambient light. HACR looks at what happens when the display is used in real-world lighting, such as direct sunlight, bright cockpit lighting, marine glare, outdoor industrial environments, emergency vehicles, or portable test equipment used in the field.
A display can have excellent dark-room contrast and still perform poorly outdoors if the front surface reflects too much ambient light.
The 5:1, 10:1 and 20:1 white/black ratio bands are illustrative engineering comparison guidance, not universal readability requirements or pass/fail limits. Select acceptance criteria for the application, content, observer and measured conditions; these bands do not apply to Weber contrast.
Why Ambient Reflection Destroys Contrast
Ambient light reflects off the front surfaces of a display stack. This includes the outer touch surface, internal air gaps, optical adhesive interfaces, polarizers, display glass, and other material transitions where refractive index changes occur.
Every reflected contribution adds light to the black level. When the black level rises, the display loses contrast.
This is why two displays with the same dark-room contrast ratio can perform very differently in bright environments.
A display may look sharp indoors but become washed out in sunlight because reflected ambient light overwhelms the image.
High Ambient Contrast Ratio Calculator
Compare how an optically bonded AR capacitive touch stack performs against a capacitive touch display with an air gap in bright ambient light.
Current model: Optically Bonded AR Capacitive Touch. Rt = 0.7%.
White/black ratio: HACR = (W + Lr) / (B + Lr); dark-room ratio = W / B. Lr = E × rho / π (E is A; rho is Rt as a fraction: 0.7% = 0.007). Enter emitted luminance excluding ambient reflection. For measured totals, divide directly without adding Lr. This is a diffuse-equivalent estimate, not directional/specular glare or a temperature prediction. Use measured or validated hot-panel inputs for Hot Contrast. The 5:1, 10:1 and 20:1 white/black ratio bands are illustrative engineering comparison guidance, not universal readability requirements or pass/fail limits. Select acceptance criteria for the application, content, observer and measured conditions; these bands do not apply to Weber contrast.
Contrast convention and measurement conditions
HACR = (W + Lr) / (B + Lr); dark-room contrast = W / B. W and B are emitted white and black luminance, excluding ambient reflection. Lr = E × rho / π, where E (also labeled A) is illuminance in lux and rho (also Rt) is a fraction: 0.7% = 0.007 and 12% = 0.12. The model assumes equal reflected luminance in white and black states. If measured white and black already include ambient light, divide those totals directly; do not add Lr again. This diffuse-equivalent estimate does not predict directional/specular glare. Hot Contrast requires inputs measured or validated at the specified panel temperature; this calculator does not predict temperature effects. Stack reflectances are illustrative assumptions, not product specifications.
For a bright feature on a dark background, Weber contrast is (W − B) / (B + Lr) = HACR − 1. A white/black ratio of 5:1 therefore corresponds to a Weber value of 4 (400%), not 5. Do not transfer acceptance thresholds between definitions.
The 5:1, 10:1 and 20:1 white/black ratio bands are illustrative engineering comparison guidance, not universal readability requirements or pass/fail limits. Select acceptance criteria for the application, content, observer and measured conditions; these bands do not apply to Weber contrast.
Definition basis: NISTIR 6738 (Kelley, 2001), CIE display luminance contrast ratio, and IES luminance contrast / Weber fraction. These references support the definitions and measurement context, not the illustrative 5/10/20 bands.
The HACR Formula
HACR compares the display’s white and black luminance while accounting for reflected ambient luminance.
HACR = (W + Lr) / (B + Lr)
Where:
A = Ambient illuminance, in lux
Rt (rho) = Total front reflectance as a fraction (displayed percent divided by 100)
Lr = Reflected ambient luminance, in cd/m² equivalent
W = Emitted white luminance, excluding ambient reflection, in cd/m²
B = Emitted black luminance, excluding ambient reflection, in cd/m²
A simplified diffuse-equivalent reflection model can be used to estimate reflected ambient luminance:
Lr = A × Rt / π
Actual results vary depending on surface finish, viewing angle, haze, anti-reflective coating performance, polarization, cleanliness, and whether the reflection is specular or diffuse.
Example: 25,000 Lux Ambient Illumination
Consider a high-bright display with:
Ambient illumination: 25,000 lux
Display white luminance: 1,500 cd/m²
Display black luminance: 2 cd/m²
Dark-room contrast: 750:1
In a dark room, this display looks excellent. But the real question is what happens when it is placed in a bright environment.
Optically Bonded AR Capacitive Touch Display
For an optically bonded display with AR capacitive touch, assume total front reflection is reduced to approximately 0.7%.
That reflected ambient luminance becomes:
Lr = 25,000 × 0.007 / π
Lr ≈ 56 cd/m²
Using the HACR formula:
HACR ≈ 26.96:1
This model predicts a higher white/black ratio because reflected ambient light is lower. It does not by itself establish readability for a particular task or installation.
Capacitive Touch Display With Air Gap and No AR
Now compare the same display brightness and black level with a conventional air-gap stack and no AR treatment. Assume total front reflection is approximately 12%.
That reflected ambient luminance becomes:
Lr = 25,000 × 0.12 / π
Lr ≈ 955 cd/m²
Using the HACR formula:
HACR ≈ 2.57:1
The display may still be bright, but the image becomes washed out because the reflected ambient light is too high. The black level has effectively been lifted by glare.
This is the key lesson: the display did not get worse. The optical stack did.
Why Optical Bonding Improves Readability
Optical bonding improves display readability by reducing internal reflections in the display stack. Instead of leaving an air gap between the touch panel, cover glass, and display, optical bonding fills the space with an optically clear adhesive or silicone.
This reduces refractive index mismatches and eliminates many of the reflection-producing interfaces inside the stack.
When combined with anti-reflective surface treatments, optical bonding can dramatically reduce reflected ambient light and improve HACR.
Optical Bonding Is Not Just About Contrast
Improved sunlight readability is one of the most visible benefits of optical bonding, but it is not the only benefit.
Optical bonding can also improve:
Ruggedness by supporting the front glass and display structure.
Reliability by reducing movement, shock sensitivity, and vibration effects.
Environmental protection by helping prevent condensation, contamination, and moisture intrusion into the display stack.
Optical stability by reducing internal glare and improving perceived image clarity.
For demanding applications, these benefits can be as important as the improved contrast ratio.
Applications That Demand High HACR
High Ambient Contrast Ratio matters anywhere the display must remain readable under bright or variable lighting conditions.
Typical applications include:
Avionics
Cockpit displays, mission systems, and flight-essential information.
Marine
Navigation, radar, fish-finding, and helm displays exposed to sun and water environments.
Outdoor and Industrial
Kiosks, electric vehicle chargers, heavy equipment, agricultural equipment, and industrial HMIs.
Military and Defense
Ground vehicles, portable systems, and mission-critical displays.
Medical Transport
Emergency vehicles, mobile medical equipment, and ambulance displays.
Test and Measurement
Portable and benchtop systems used in bright environments.
In these applications, readability is not just a convenience. It can affect safety, usability, mission performance, and customer satisfaction.
Brightness Helps, But Reflection Control Wins
Increasing display brightness can help, but it is often an inefficient solution if reflections are not controlled.
A brighter backlight can increase power consumption, heat, cost, and thermal stress. In battery-powered or sealed systems, this can create additional engineering problems.
Reducing front reflection can deliver a larger improvement in real-world readability without forcing the display to overpower the environment.
In high ambient light, contrast is not just about brightness. It is about controlling reflected ambient light so more of the display image reaches the viewer.
The Key Takeaway
A display should not be judged by dark-room contrast alone.
For real-world environments, especially bright or outdoor applications, High Ambient Contrast Ratio is a better measure of actual usability.
Optical bonding, AR coatings, and careful front-stack design can turn a display that looks washed out in sunlight into one that remains readable, useful, and reliable.
For high ambient environments, the question should not simply be:
“How bright is the display?”
The better question is:
“What is the HACR of the complete display system in the lighting environment where it must operate?”