Chapter 2 - Temperature and Pressure
Chapter 2 of 7 | FPD.DEV | Development edition A-P15
Temperature and Pressure
Hot Contrast and cold moving information; Thermal lag, material response and test sequence; Pressure loads, decompression and venting. Use the reading-page controls below the presentation for explanations and worked practice.
Open chapter with slide navigation and reading-page controls | Download chapter slides PDF (27 pages)
Slide narration transcript
Slide 20: Temperature and Pressure
FPD.DEV. The Future of Display and Systems Development. Welcome to Chapter 2, Temperature and Pressure. We will connect the actual temperatures and pressure loads in a display to the image the operator sees. Follow the worked examples, then use the reading pages to develop measurements and acceptance criteria for your own assembly.
Slide 21: Operating state gives a limit meaning
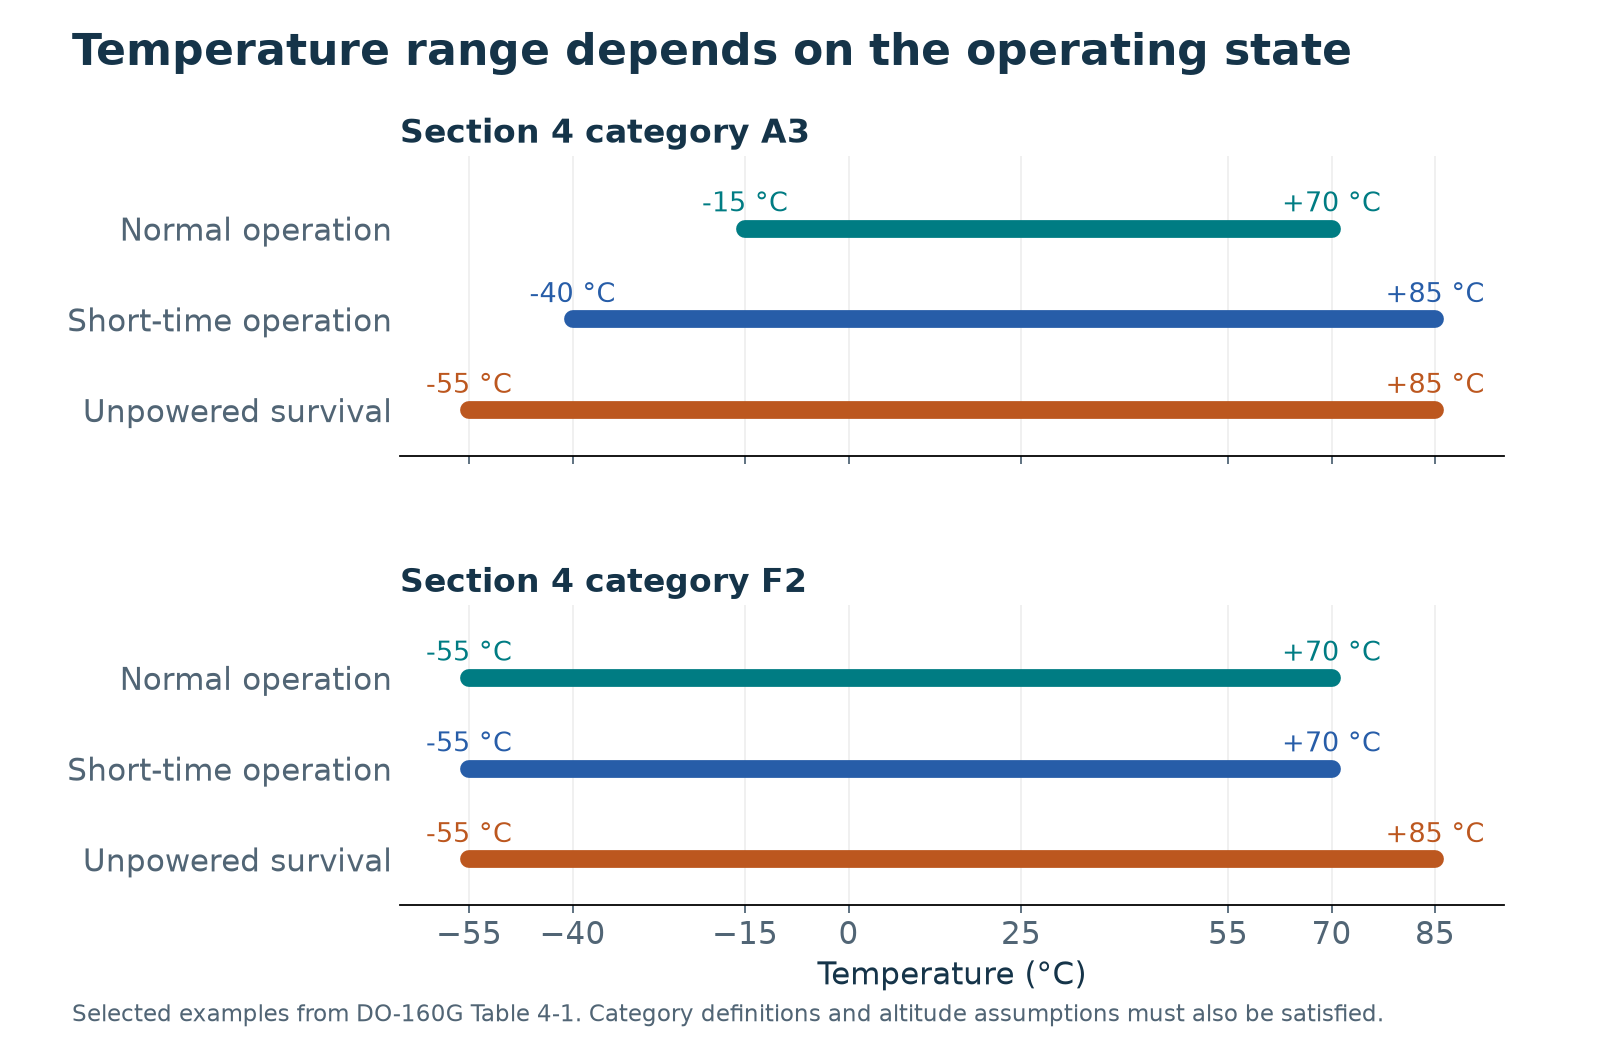
A temperature range needs an operating state. Ground survival tells us what the equipment can withstand under its prescribed unpowered exposure and evaluation. Normal operation requires the specified functions at the operating condition. Short-time operation has its own sequence and timing. So, so a plus-eighty-five survival result cannot support a claim of continuous operation at plus eighty-five. The same distinction applies to acceptance criteria: the plan must say what the display does, when we observe it, and how we judge the result.
Slide 22: Reading Table 4-1
This small crop shows the original table headings and the first three A categories. Follow the A-three column. Its operating low temperature is minus fifteen degrees Celsius, while the short-time operating low temperature is minus forty. Those are different requirements in the same category. The excerpt demonstrates why copying only the coldest number changes the claim. This crop omits the remainder of the table. Use the complete category definition, other conditions and associated procedures in the adopted standard.
Slide 23: Cold response and moving information
Cold increases liquid-crystal viscosity and slows the optical response. A static image may look acceptable while moving dials, indicators, scrolling text or maps blur, trail or become difficult to interpret. This is pixel settling time, which differs from the frame refresh rate. Include representative motion and critical gray-to-gray transitions in cold-start and stabilized cold-operation checks. Define acceptable response and readable-information timing for the application. A suitable LC material, controlled heater or drive compensation may help, but verify warm-up time, power, uniformity and the actual assembly.
Slide 24: CTE: what changes, and by how much?
C T E means coefficient of thermal expansion. Linear C T E is the fractional change in length per degree. The simple equation multiplies the material coefficient by the initial length and the temperature change. Use it over an interval where the coefficient is approximately constant. Parts per million means a factor of one millionth. A temperature change has the same numerical value in kelvins and degrees Celsius.
Slide 25: Worked example: 0.120 mm of mismatch
Take the optical bonding course example: coefficients of twenty-three and eight parts per million per kelvin, a one-hundred-millimeter distance from a center constraint, and an eighty-kelvin temperature change. The coefficient difference is fifteen parts per million per kelvin. Multiplying gives zero point one two zero millimeters of relative free movement. These are teaching inputs, not glass or bezel specifications. Bonding and restraint convert incompatible free movement into deformation and stress.
Slide 26: Stiffness, force and movement
Stiffness describes how much force a structure develops for a given movement. Watch the left comparison. We move both joints by one millimeter. The stiffer joint develops forty newtons, while the more compliant joint develops ten. Now watch the right comparison. We apply ten newtons to each joint. The more compliant joint moves one millimeter, while the stiffer joint moves only a quarter of a millimeter. These are two different boundary conditions. A compliant bond can reduce the force caused by imposed thermal mismatch, yet allow more movement under an external force. Neither result makes softer automatically better. Material modulus and assembly stiffness are also different. For a simple axial bar, stiffness equals Young's modulus times area divided by length. For a shear bond, area and thickness matter too. These illustrative springs keep geometry fixed so we can isolate stiffness. Real display joints also depend on temperature, loading rate, damping and their exposure history.
Slide 27: Temperature and loading rate
Now we add time and temperature. Each specimen reaches the same final strain. Teal shows the fast ramp, completed in six tenths of a model second. Amber shows the slower ramp, completed in six seconds. The upper strips show the imposed movement. The curves below show the resulting normalized stress. The cooler example on the left relaxes slowly. The warmer example on the right relaxes more quickly. These are assumed relaxation times, not measurements of a particular adhesive. Watch the fast ramp finish. Its movement stops, but the stress continues to decrease during the hold. That is stress relaxation. The slow ramp gives the material more time to relax while it is moving, so it reaches the target strain with a lower stress in this model. Later, the fast-ramp curve can fall below the slow-ramp curve because it has already spent longer relaxing. Compare the peak stress at the end of each ramp, and distinguish that from a comparison at the same clock time. At either temperature, faster loading can make the same material appear stiffer over the event. At the warmer condition, more of the stress relaxes within the same time window. This illustrates a common viscoelastic pattern within a suitable material regime. Actual glass transitions, phase changes, cure, aging or irreversible shrinkage can change that behavior. Mechanical strain rate is not the same quantity as a chamber temperature ramp in degrees per minute. Thermal ramp rate also affects temperature gradients and the time available for relaxation. Use the actual material data and exposure history.
Slide 28: Bond thickness and shear strain
The two bonds now undergo the same relative movement between their faces. The upper adherend moves while the lower one stays in place. The bond at left is half a millimeter thick. The bond at right is one millimeter thick. At the illustrated displacement of fifty micrometers, the thinner bond has ten percent shear strain, while the thicker bond has five percent. Shear strain is relative displacement divided by thickness. The leaning grid lines make that difference visible. If we assume a constant shear modulus of zero point two megapascals, the simple elastic model gives twenty kilopascals and ten kilopascals of shear stress. Those are teaching inputs, not supplier values or allowable stresses. A real viscoelastic bond has a stress history that depends on temperature and loading rate, as we just saw. Thickness also affects optical spacing, cure and processing. This uniform shear model does not capture edge peel, local stress concentrations, creep or interface failure. A thicker bond is therefore a design choice to evaluate, not an automatic improvement.
Slide 29: Laminate mismatch and restraint
Think of a bimetal thermometer. Its joined layers would change length by different amounts if they were free. Because they stay connected, the strip bends. In the first part of this animation, the film would expand more than the glass. The longer layer lies on the outside of the curve. Compare the three arrangements. An asymmetric laminate can bend. Matching films on the front and rear can balance the bending effect, while still carrying internal stress. A support that holds the stack flat supplies a reaction moment. Flatness alone does not show that the layers are stress free. Now the film's free dimensional change reverses. It wants to shrink relative to the glass, so the free laminate bends the other way. This second case helps explain heated polarizer films. The OEM LCD is already a bonded laminate before we add a cover window. A typical polarizer includes stretched polyvinyl alcohol, or P V A, protective films and a pressure-sensitive adhesive. Heat can release stored orientation in stretched P V A, producing shrinkage while the glass expands. Direction, moisture, drying, cure and aging all affect the response. At cold temperatures, some adhesive and polymer layers stiffen and relax more slowly. Our three-layer sketch is deliberately simpler than the real LCD. It assumes perfect bonding and elastic layers, uses illustrative dimensions and moduli, and exaggerates bow so you can see the mechanism. Its stress labels are model results, not LCD predictions. The previous animation explains why a compliant adhesive changes load transfer with time and temperature. Stress can change film retardation and cause light leakage or mura. Glass bending can also alter cell-gap uniformity, but mura alone does not prove a cell-gap change. Edge peel, delamination and cracking require further analysis and testing. Inspect during hot and cold exposure and again after recovery. Some effects recover and some persist. Our Optical Bonding course explains the actual cell construction in Chapter two, then develops expansion, compliance and mura in Chapter six.
Slide 30: A display has several temperatures
A chamber setpoint is the target air temperature. Verify the measured air temperature near the equipment. A controller setting or chamber-wall measurement alone does not establish the exposure, and neither tells us the temperature of every part of the display. The backlight, power converter and transparent heater generate heat. The enclosure and mount conduct it away, and the optical stack can absorb sunlight. Place sensors where the requirement and the suspected failure mechanism demand them, while checking that the sensors do not disturb the optics or heat path. Record the temperatures with operating mode and input power. A claim for operation at a stated ambient temperature needs evidence that the internal parts remain within the limits adopted for the enhanced assembly.
Slide 31: Hot Contrast: a worked comparison
Here is an illustrative Hot Contrast comparison at a panel temperature of seventy degrees Celsius and fifty thousand lux at the display surface. All luminance values are measured in the observer direction with that ambient illumination present. These are total measured luminances, so we do not add ambient reflection again. Before enhancement, white is eight hundred and black is two hundred candelas per square metre, so contrast is four to one. After reducing reflections, white is seven hundred and twenty and black is one hundred and twenty, giving six to one. White luminance decreased, yet ambient contrast improved. These invented values explain the calculation. The actual test must define illumination geometry, spectrum, viewing direction and instrument uncertainty, then measure the real display.
Slide 32: Cold motion and heater control
A cold display can show a sharp stationary image while a moving pointer leaves a trail. Low temperature slows the liquid crystal optical response, so a fast video interface does not guarantee a fast visible transition. Exercise representative grey transitions and the actual symbols at the intended update rate. Record warm-up time, smear and overshoot, including any drive compensation. A transparent heater can extend the usable ambient range, but the control system needs temperature sensing, power budgeting and protection against overheating. Check a failed sensor or stuck heater command against the product safety requirements. The useful result is a demonstrated operating envelope for the complete heated display.
Slide 33: A temperature procedure has stages
A procedure is more than a setpoint and a dwell. Identify the conditioning, power state, stabilization rule and the event that starts each timer. Chamber air and the display assembly can reach equilibrium at different times. In the course example, the chamber reaches seventy degrees at nine, but the equipment stabilizes at nine forty. Stopping at eleven provides only eighty minutes after stabilization. It does not demonstrate a two-hour post-stabilization requirement. Keep the raw histories and the complete prescribed sequence.
Slide 34: Temperature variation and thermal lag
Section five assigns minimum chamber rates of ten, five and two degrees Celsius per minute to categories A, B and C. These letters belong to section five and do not replace the section four category. For an assumed transition from minus forty to plus seventy, the temperature difference is one hundred ten degrees. At exactly five degrees per minute, the ideal transition takes twenty-two minutes. That is only the ramp. The panel can lag the air, and the complete test includes additional stages and checks.
Slide 35: The complete variation sequence
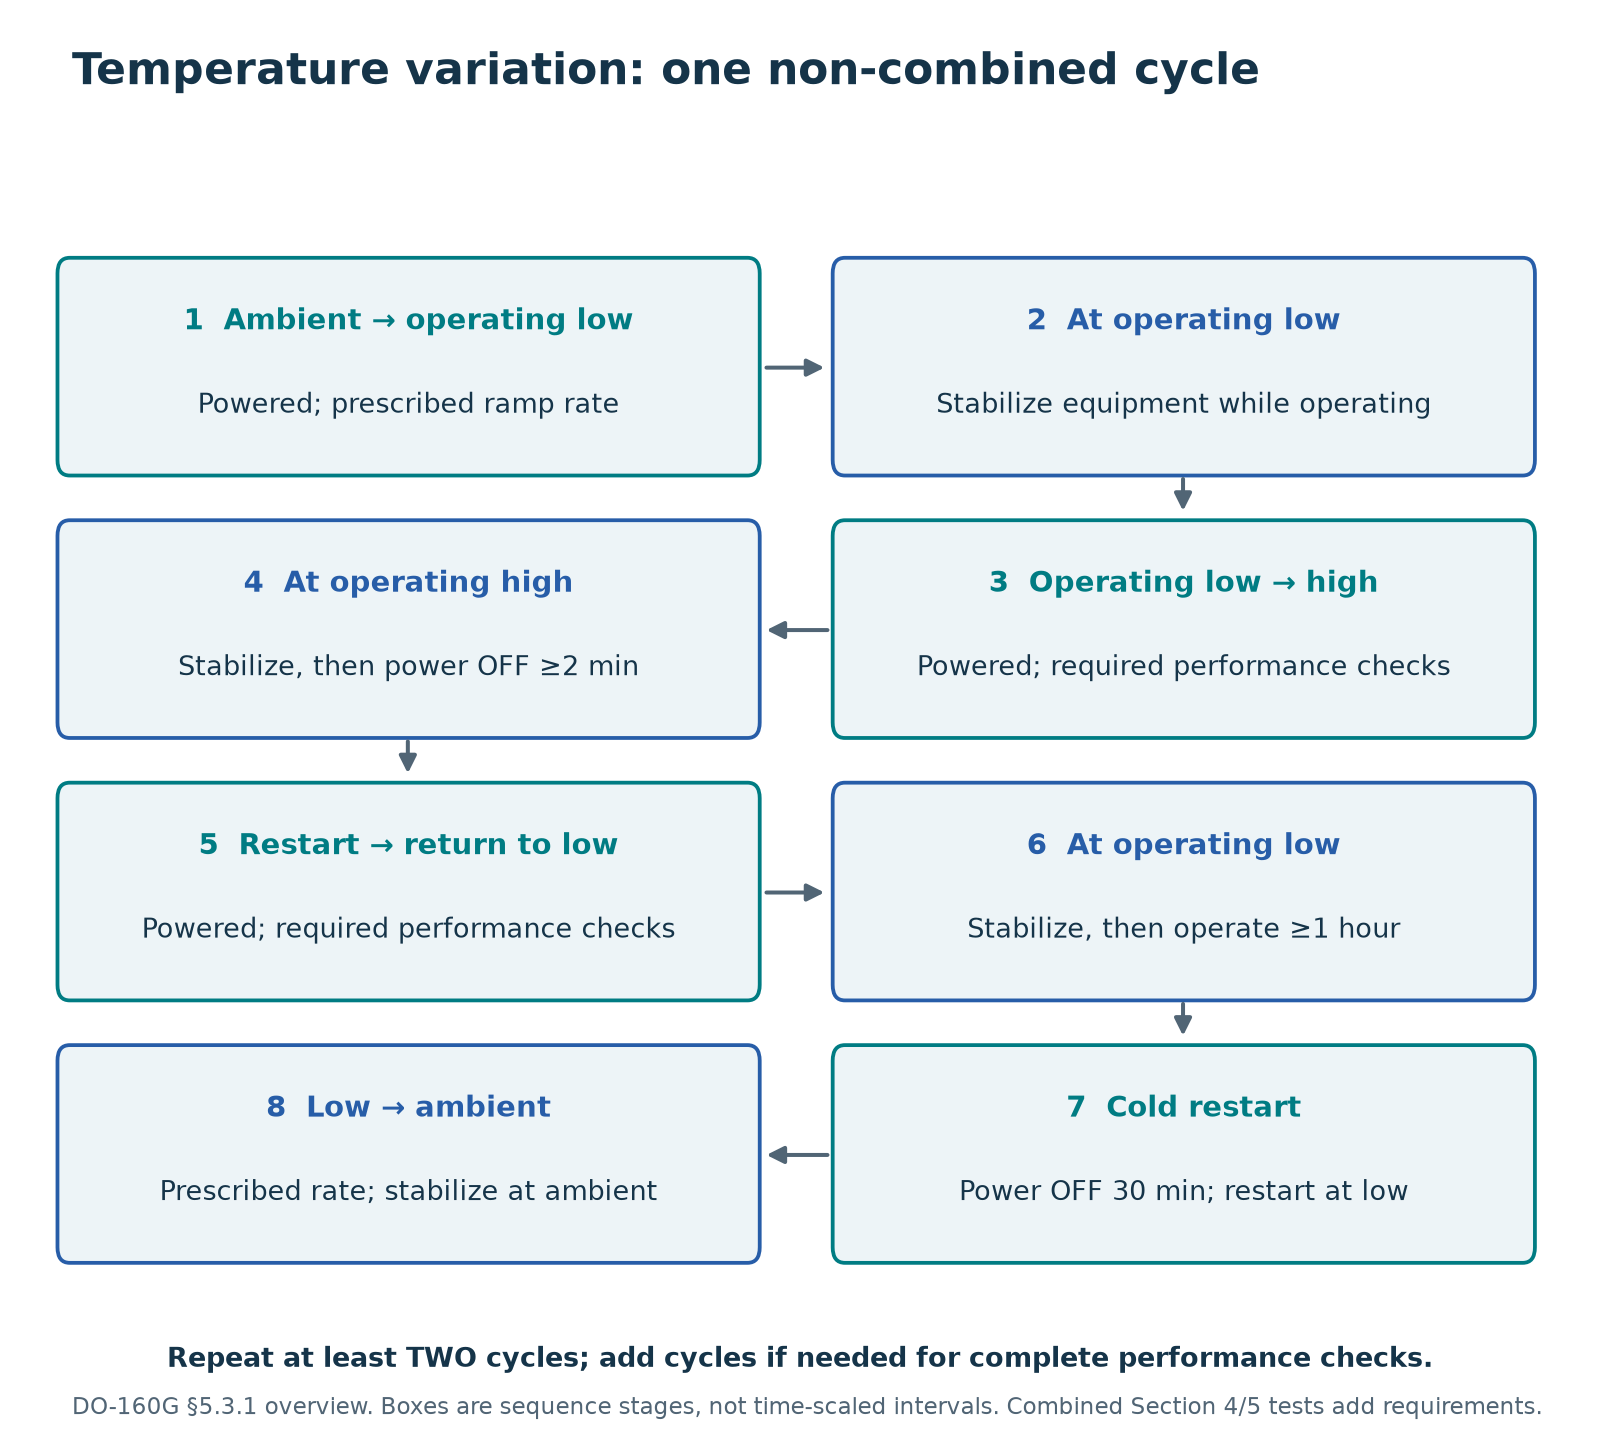
The complete variation procedure includes stabilization, specified operation, power-off and restart stages, and the required performance checks. For A, B and C, at least two cycles are required, with additional cycles if needed to complete the checks. A large number of slow development cycles does not automatically replace the selected qualification method. The figure summarizes the noncombined sequence. Notice the power-off interval of at least two minutes at the high-temperature stage, the operation for at least one hour after low-temperature stabilization, and the thirty-minute power-off interval before the cold restart. Follow the complete sequence in section five; Page six provides a larger reading figure. If you combine sections four and five, preserve all applicable requirements of both. Keep actual temperature traces, power events and anomalies aligned in time.
Slide 36: Thermal lag changes the exposure
During a rapid chamber transition, the cover glass, LCD frame, bondline and housing do not change temperature at the same rate. Their transient mismatch can differ from the mismatch after equilibrium. A large metal fixture can also delay the response or provide an unintended heat sink. Use the stabilization definition and transition requirements in the adopted procedure, and record representative item temperatures as supporting evidence. Do not replace the prescribed exposure with an arbitrary wait until one convenient sensor settles. During development, instrument several locations to learn which gradient coincides with a contrast change, bond-edge defect or loss of touch accuracy.
Slide 37: Temperature evidence before and after
The display returns to room temperature and looks normal. That establishes recovery, but it does not erase a loss of function while hot or cold. Prepare the baseline using controlled patterns, brightness settings and measurement geometry. During the test, collect the signals needed to judge the required operating behaviour. After the specified recovery, repeat the baseline and inspect for permanent changes. A reversible contrast collapse, a temporary link reset and a permanent bond defect are different observations with different acceptance consequences. Tie each observation to the actual requirement. Preserve the time history so a later reviewer can distinguish an exposure failure from an instrument interruption.
Slide 38: Absolute pressure and altitude
The word absolute in this table matters. Eight thousand feet corresponds to about seventy-five point two six kilopascals absolute in this reference. Gauge pressure uses a different reference and cannot simply be substituted. The cropped table is useful for reading the units, but it does not select your final altitude or procedure. Record the aircraft environment, initial and final absolute pressures, transition timing and required operation. Use the adopted table and tolerances when writing the laboratory procedure.
Slide 39: Decompression is a pressure transient
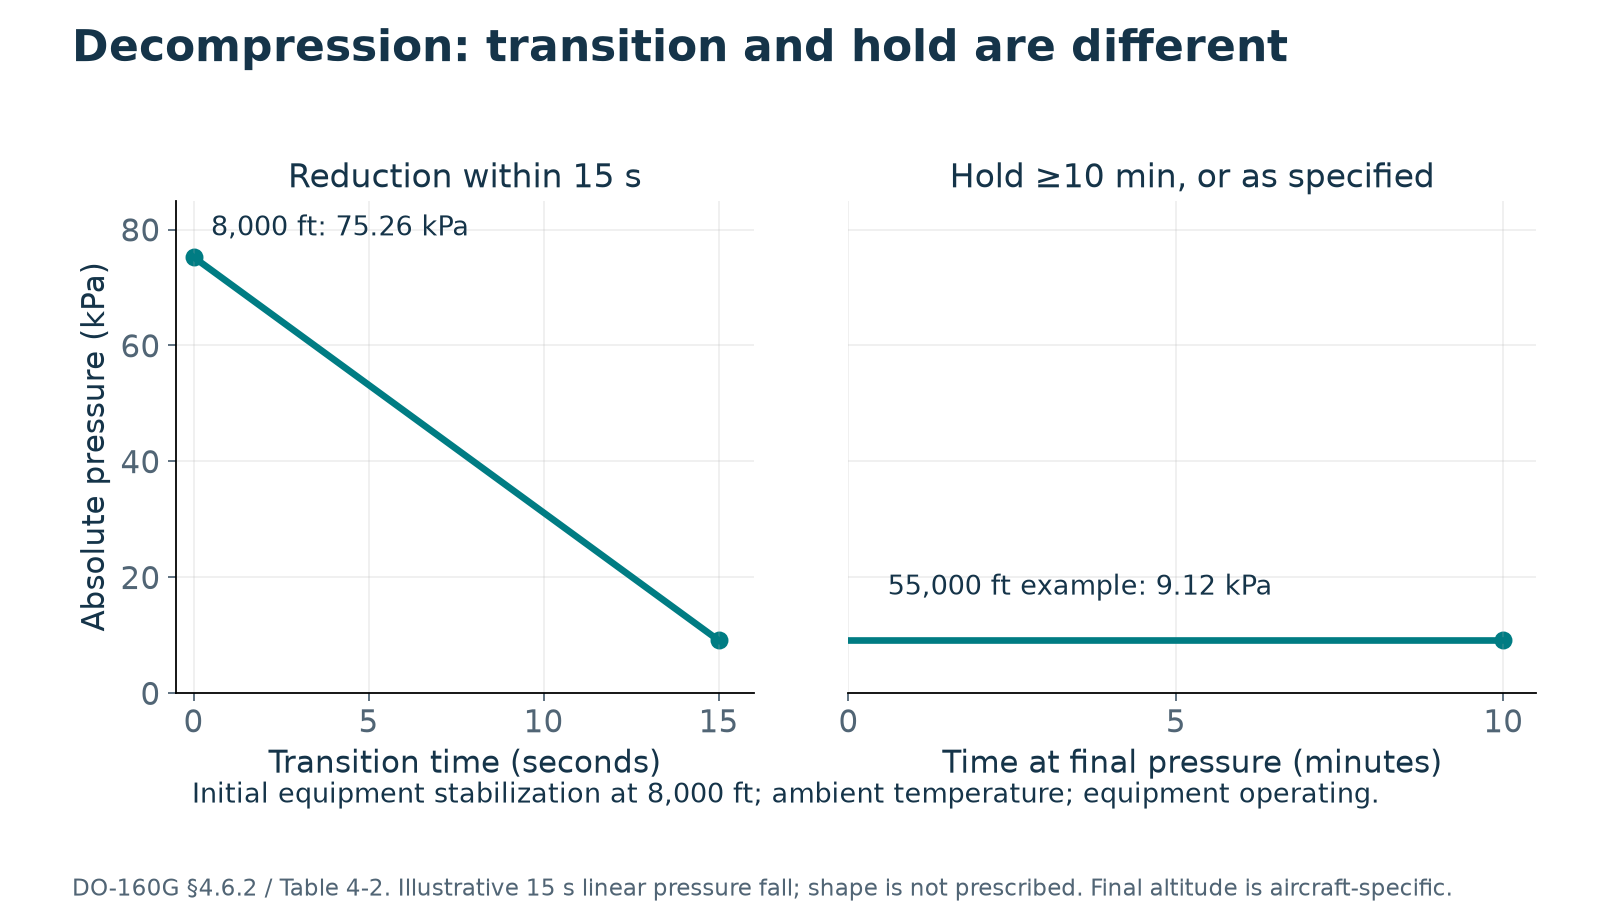
For installations where this test applies, the section four decompression method starts at ambient temperature, with the equipment operating and stabilized at eight-thousand-foot equivalent pressure. It then reduces pressure to the aircraft maximum operating-altitude equivalent within fifteen seconds. The final condition lasts at least ten minutes, or as specified, with the required operation and checks. Fifty-five thousand feet in this plot is an example. Sixty-five thousand feet is not a universal requirement. Trapped volumes, optical cavities and vent paths matter. A stabilized altitude soak and a rapid pressure transition challenge different mechanisms, so an identical endpoint does not make them equivalent.
Slide 40: Pressure-test equipment
This public-domain NASA image shows a large thermal-vacuum vessel. It illustrates the pressure boundary, door and test enclosure. It does not show an aircraft-display qualification setup. For our display, the specified altitude and decompression method determines the pressure range, rate, hold and operating state. Select a suitable vessel, feedthroughs and instrumentation, then record absolute pressure at the required locations. A facility's lowest achievable pressure is not the qualification requirement.
Slide 41: Altitude, decompression and trapped air
As external pressure falls during ascent or decompression, trapped gas may expand and gas can flow through available paths toward lower pressure. If a cavity cannot equalize quickly, a pressure difference loads its walls and bonded interfaces. A flexible air pocket may enlarge. A rigid sealed cavity may instead carry the pressure difference with little volume change. For a freely expanding ideal-gas pocket at constant temperature, halving absolute pressure doubles the equilibrium volume. That simple example is not a prediction for a restrained adhesive void or for rapid decompression, where temperature and transient flow matter. Evaluate void size, vent paths, permeability, geometry and pressure-change rate. Low outgassing and pressure resistance are separate questions.
Slide 42: Adhesive and cohesive failure
An expanding air pocket can impose opening and peel loads around a bonded region. If those local loads exceed the available resistance, separation may occur at an interface or a material may tear internally. Adhesive failure means separation at the interface between materials. Cohesive failure means rupture within a material, such as the silicone or another adhesive layer. The neighboring polarizer, coating or glass can also fail. Inspect both separated surfaces and identify which layer actually remains on each side. A strong optical bond does not protect every weaker layer beneath it. Record mixed failures and optical distortion as well as obvious separation. The optical bonding course develops this failure analysis in more detail.
Slide 43: Pressure effects across the adhesive system
Review every adhesive-containing part of the assembly, not only the optical bond. Include optical silicones and films, conductive EMI tapes, adhesive-backed gaskets, sealants, and potting or encapsulating compounds. These material families are all within the review scope. Their susceptibility is not identical. A void, a poorly vented pocket or a weak interface must be considered together with the material and pressure profile. A mechanically retained gasket also needs its own seal and cavity-pressure assessment. Control mixing, degassing, application, wetting and cure as appropriate to the qualified process. Verify representative assemblies, including adverse permissible tolerances. After exposure, inspect bubbles, edge lift and separation, and check optical performance, sealing and electrical continuity where relevant.
Slide 44: Pressure difference loads the window
Consider a sealed window with an exposed area of two hundred by one hundred and fifty millimetres. Its area is zero point zero three square metres. An illustrative pressure difference of twenty kilopascals creates a resultant force of six hundred newtons, using force equals pressure difference times area. This is a net load, not a prediction of glass stress or bond-edge stress. Those depend on geometry, support, stiffness and the changing internal pressure. A vent changes the pressure history, and its flow capacity matters during decompression. Use the real installation and selected pressure profile to establish loads before assessing deflection, clearances and attachment strength.
Slide 45: Vents, seals and pressure monitoring
A vented enclosure can still develop a pressure difference when outside pressure changes faster than air can pass through the vent. Measure internal and external pressure with enough time resolution to capture the transient, and document the tubing and sensors because they can alter the volume or flow path. Include the actual membrane, filter and mounting arrangement. A moisture-resistant vent also creates design trade-offs in ingress protection and pressure equalization. Look for window movement, trapped-bubble growth and changes in sealing after exposure. A successful slow altitude dwell does not by itself demonstrate behaviour during the specified decompression transient.
Slide 46: Chapter 2 complete
You have completed Temperature and Pressure. Use the supporting reading pages to work through the examples and record the evidence you would need for your display. Next we continue with Moisture and Contamination. Our Optical Bonding course develops the material and bondline mechanisms in greater detail. FPD.DEV. The Future of Display and Systems Development.
Reading pages
Page 5: Temperature, material response and qualification claims
Animated explanations: stiffness, temperature, loading rate and laminates
Chapter 2 slides 26–29 now contain four animated diagrams. Select a slide, press Play, then pause or scrub to compare the mechanisms. The complete still diagram appears when you first select a slide. These are teaching models with stated assumptions, not measured properties of an OEM panel or adhesive.
| Slide | What moves | What to notice |
|---|---|---|
| 26: stiffness | Two ideal joints under imposed displacement, then imposed force | A stiffer joint develops more force for the same movement. A compliant joint moves farther under the same force. |
| 27: temperature and loading rate | Fast/slow strain ramps, stress curves and a shared time cursor | Fast loading permits less relaxation during the ramp. At a fixed final strain, stress continues to relax. The warmer example has a shorter relaxation time. |
| 28: bond thickness | Upper adherends slide, deforming the bond grid | At the same imposed displacement, halving thickness doubles the simple shear strain. Modulus controls the corresponding elastic stress. |
| 29: laminate restraint | Film/glass strips bow as the free mismatch changes sign | Free asymmetric, balanced and held-flat laminates carry different stress and curvature. A flat laminate can remain stressed. |
The stress curves can cross: at the same clock time, the fast-ramp specimen has spent longer relaxing after its ramp. Compare the stress at the end of each ramp when discussing the peak loading-rate effect, and keep the hold duration explicit.
Three rates that should not be confused
Mechanical strain rate is the change in strain per second. Force loading rate is a force change per second; it only gives strain rate after accounting for the assembly response. Thermal ramp rate is a temperature change per time, commonly °C/min. A rapid thermal ramp can create gradients because the glass, film, adhesive, housing and heater do not necessarily reach the same temperature together. These gradients change mismatch, while the event duration determines how much stress can relax.
A cold adhesive may transfer more load during a short event if its relevant modulus rises and relaxation slows. A warmer adhesive may relax more over the same duration. This is a common pattern within a suitable viscoelastic regime, not a universal law for every polymer, transition or temperature. Greater compliance can reduce mismatch loads while increasing deflection, creep or settling. Evaluate the optical and mechanical consequences together.
How this reaches the LCD
The OEM polarizer adhesive and an added optical bond are different interfaces. Their stiffness and time dependence determine how much dimensional mismatch reaches the glass, films, cover and mounts. An asymmetric stack can bow; balancing the front and rear reduces some bending effects but does not eliminate internal stress. Holding the assembly flat adds support reactions. In a real laminate, load transfer near free edges introduces shear and peel that the simple beam animation does not calculate. Neither flatness nor a low average stress establishes interface durability or optical acceptance.
Model equations, assumptions and illustrative inputs
Stiffness: F = ku. The two assembly stiffnesses are 10 and 40 N/mm. For a uniform axial bar, k = EA/L, where E is Young’s modulus, A is area and L is length. A uniform shear layer instead has k = GA/t. These elementary relations require their stated geometry and deformation mode.
Time dependence: the standard linear solid uses G(t) = G∞ + (G₀ − G∞) exp(−t/τᵣ). Here G∞/G₀ = 0.2, with relaxation times τᵣ = 8 and 0.8 model seconds. The strain ramps last 0.6 and 6 model seconds. Stress is normalized by G₀εtarget, so the plot does not assign an actual modulus or target strain. During a ramp of duration R, normalized stress is 0.2t/R + 0.8τᵣ/R[1 − exp(−t/τᵣ)]. After the ramp, it is 0.2 + 0.8τᵣ/R[1 − exp(−R/τᵣ)]exp[−(t − R)/τᵣ]. The model is linear, isothermal within each case and has one relaxation time. The warmer/cooler labels illustrate a shift in relaxation time; no °C values or material master curve are inferred. This is stress relaxation at held strain. Creep instead means strain evolves under held stress.
Shear: γ = Δu/t and τ = Gγ for the stated uniform linear-elastic approximation. Δu = 0.05 mm, t = 0.5 or 1.0 mm, and assumed G = 0.20 MPa produce 10% or 5% strain and 20 or 10 kPa stress. These are illustrative inputs, not allowable values. The letter τ denotes shear stress here; τᵣ denotes relaxation time above.
Laminate: a unit-width elastic beam uses ε(z) = ε₀ + κz and σᵢ = Eᵢ[ε₀ + κz − ε*ᵢ]. Define A = Σ∫E dz, B = Σ∫Ez dz, D = Σ∫Ez² dz, N* = Σ∫Eε* dz and M* = Σ∫Eε*z dz. A free beam solves Aε₀ + Bκ = N* and Bε₀ + Dκ = M*. Holding curvature κ = 0 while allowing axial motion gives ε₀ = N*/A and a support reaction moment Bε₀ − M*. This restraint does not fix the in-plane length.
The illustrated glass layer is 1.0 mm thick with assumed E = 70 GPa. Each film is 0.2 mm thick with assumed E = 3 GPa. The film’s free strain relative to glass changes from +0.5% to −0.5%. The mean film stress labels come from the model in MPa. The symmetric case adds an identical rear film. Perfect bonding, small strain, uniform temperature, elastic response and plane sections are assumed. The model omits adhesive shear lag, edge peel, Poisson coupling, directional film properties, viscoelastic relaxation and actual LCD cell geometry. Bow is exaggerated for visibility. No actual LCD curvature, safe temperature, mura threshold or delamination limit is predicted.
Technical basis: Open University: viscoelasticity; MIT: laminate mechanics. The original FPD.DEV teaching models simplify these relationships. See the OEM polarizer section below and the linked Optical Bonding course for the real layer construction and stack-specific optical effects.
Temperature and pressure: interpreting a claim
DO-160 Display Qualification | A-P13 — Development edition
Learning objective: Interpret a numerical qualification claim before reading its complete test procedure.
Every limit needs a state and source
A statement such as “−55 °C to +85 °C qualified” leaves essential questions unanswered. Does it describe normal operation, short-time operation or unpowered ground survival? At what boundary, and under which category and procedure? The acceptance criteria establish what usable display behavior means in each required state.
One category contains different temperature conditions
As a selected example, DO-160G Table 4-1 gives A3 operating low/high values of −15 °C / +70 °C, short-time operating values of −40 °C / +85 °C, and unpowered ground-survival values of −55 °C / +85 °C. A3 also has installation and altitude context. These values do not recommend A3 for every display. The complete category definition and procedure remain necessary.
A customer may require continuous operation from −40 °C to +70 °C. Keep that requirement explicit and determine its relationship to the adopted category instead of silently borrowing the short-time or survival numbers.
A ramp rate describes one part of a sequence
Section 5 categories use their own designations. A nominal 5 °C/min requirement still needs endpoints, power states, stabilization, cycles and performance checks. For the invented −40 °C to +70 °C example, 110 °C divided by 5 °C/min is 22 minutes. That is the ideal one-way transition, excluding stabilization and dwells. The detailed variation lesson covers the complete method distinctions and thermal lag.
An altitude number is not a pressure profile
“65,000 ft decompression” needs an aircraft or customer basis and the initial/final absolute pressures, transition, hold, temperature, power state and acceptance criteria. DO-160G §4.6.2 uses an initial 8,000-ft equivalent and the aircraft maximum operating-altitude equivalent as its endpoint. A steady altitude soak and decompression address different effects. Explosion proofness in Section 9 addresses ignition in a flammable atmosphere and is a separate subject.
Interpretation exercise
A report records a three-hour unpowered +85 °C survival exposure. The purchase requirement calls for continuous operation at +85 °C. What evidence is missing?
Worked response
The survival result supports its defined survival exposure and subsequent evaluation. It does not demonstrate continuous operation. Compare the required power state, stabilization, duration, image/control behavior and optical limits, then obtain the missing operating evidence.
Further reading
Continue to Temperature and altitude procedures for stage timing, Temperature variation and thermal lag for rates and power sequence, and Pressure, altitude and decompression for the pressure profile. Sources: DO-160G Table 4-1, §4.3, §§4.5–4.6 and §5.2. Consult the complete adopted standard.
OEM LCD layers at temperature extremes
An original-equipment-manufacturer (OEM) LCD already contains bonded layers before an integrator adds a cover window. The polarizer laminates attach to the outer faces of the glass cell. A common laminate uses stretched polyvinyl alcohol (PVA), protective or compensation films and a pressure-sensitive adhesive (PSA). Triacetyl cellulose (TAC) is one protective-film material; the actual supplier construction may use alternatives.
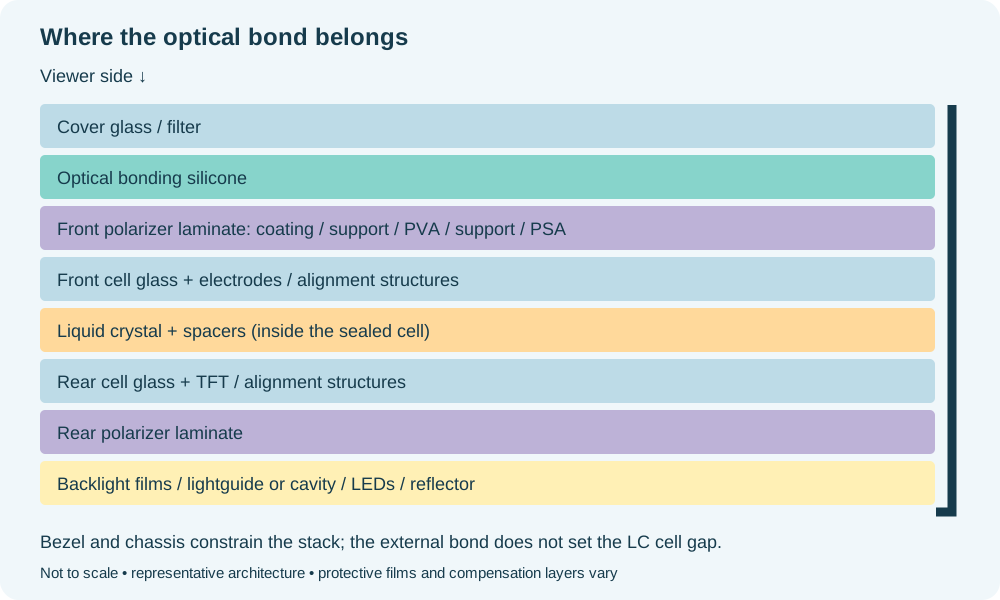
Polarizer movement relative to glass
Polymer-film dimensional change can be substantial relative to the glass over an extreme temperature excursion. Direction matters: stretched films can respond differently along and across their manufacturing orientation. Heat can release part of the stored orientation in stretched PVA and cause shrinkage, while glass undergoes ordinary thermal expansion. A single positive CTE for “the polarizer” cannot describe every film, direction, temperature interval or exposure history.
Moisture uptake and loss, aging and residual manufacturing stresses also influence the response. Depending on material and temperature, cold conditions can increase stiffness and slow stress relaxation; hot conditions can promote relaxation or permanent dimensional change. Cooling therefore need not retrace the heating response. Use the actual laminate and adhesive data rather than extrapolating a room-temperature hardness value. This mechanical behavior is distinct from the liquid crystal's slower optical response at low temperature.
The bimetal-thermometer comparison
A bimetal thermometer joins metals with different thermal expansion. Their incompatible free length changes produce bending; the layer that would be longer occupies the outside of the curve. For the simple uniformly heated strip, the higher-expansion metal lies on the outside. This illustrates how joining layers converts dimensional mismatch into stress and possible curvature.
| Comparison | Bimetal thermometer | LCD polarizer and glass |
|---|---|---|
| Connected layers | Two selected metal strips | Several polymer films, adhesive layers and glass sheets |
| Source of mismatch | Different thermal expansion | Directional expansion, film shrinkage, moisture and processing history |
| Observed response | Designed bending drives an indication | Internal stress, possible bowing, optical changes or interface damage |
| Return to the starting temperature | Designed for repeatable indication within its rated range | Some effects recover; relaxation, shrinkage or damage may leave a residual change |
The analogy explains constraint, but does not predict an LCD's bend direction, curvature or failure temperature. Front and rear laminates can partially balance bending while internal stress remains. Layer thickness, directional properties, adhesive stiffness and relaxation, temperature gradients, edge restraint and the added cover assembly all affect the result.
What changes on the display?
Stress can change optical retardation in film layers and increase black-state light leakage or mura. Bending can also disturb cell-gap uniformity. These mechanisms can coexist, but mura by itself does not prove that the cell gap changed. More severe loading may lead to polarizer edge lift, delamination or cracking. The symptom alone does not identify the failed interface.
As a development comparison, observe the OEM module in a representative support before bonding, then the enhanced assembly with its intended mounting. Record temperature, humidity/conditioning history, ramp, dwell, operating state and recovery time. Compare black and gray patterns, uniformity, contrast and physical edge condition during exposure and after return to the reference condition. Keep the separate dynamic cold-response checks. This is diagnostic guidance; the adopted DO-160 methods and agreed acceptance criteria still govern qualification.
Further detail in Optical Bonding
Optical Bonding Chapter 2: How LCDs work, layers and polarizers explains cell construction and bonding interfaces. Chapter 6: Thermomechanical design, expansion, compliance and mura develops the mechanics. The shear illustration on slide 28 explains displacement across a bond; it does not by itself model laminate curvature or optical performance.
Technical basis: Yano et al. (2008), Lin et al. (2015), and WIKA IN 00.07. The comparison and diagnostic sequence are engineering teaching synthesis. They add no universal material limit or DO-160 acceptance threshold.
CTE and the changing material stack
CTE means coefficient of thermal expansion. Linear CTE is fractional length change per degree, commonly expressed in ppm/K or ppm/°C. For approximately constant properties over the interval, ΔL ≈ αL₀ΔT. Temperature differences have the same numerical value in kelvins and degrees Celsius.
For two materials, relative free movement is Δu ≈ (α₁ − α₂)LΔT. Reusing the Optical Bonding course teaching inputs, let α₁ = 23 ppm/K, α₂ = 8 ppm/K, L = 100 mm and ΔT = 80 K. Then Δu = 15 × 10⁻⁶/K × 100 mm × 80 K = 0.120 mm. L is the distance from the selected constraint or symmetry datum. A 200 mm-wide center-referenced assembly uses 100 mm for this center-to-edge screen. These assumed coefficients are not specifications for a particular bezel or LCD glass.
Once bonded or restrained, incompatible free expansion becomes deformation and stress. The simple bond-strain screen is γ ≈ Δu/t, where t is bond thickness. It does not resolve edge peel, substrate bending, nonlinear silicone response or local constraints. Stiffness and damping also change with temperature and loading rate. Moisture uptake, cure shrinkage, relaxation and aging contribute changes beyond thermal expansion. Stretched polarizer films may be anisotropic, with different responses along different directions. Use actual grade, direction and temperature data.
The selected optical silicone may accommodate movement, but its compliance does not remove all load from the LCD. Check local thickness and every interface, including the polarizer laminate. The Optical Bonding course thermomechanical chapter provides the fuller explanation, models and limitations.
Page takeaway
- Label every stated limit with its operating state, category context and source. Leave procedure timing to the detailed method lessons.
Follow the material change into the joint
Companion to slides 24–29. Use the separated explanations as a six-step review of the display stack.
- Define CTE. Coefficient of thermal expansion describes fractional dimensional change per degree.
- Calculate the free movement. The assumed 23 and 8 ppm/K materials, 100 mm center-to-edge length and 80 K change give 0.120 mm relative movement.
- Check temperature-dependent properties. Expansion is only one change; stiffness and damping also affect load transfer.
- Check moisture, cure, aging and direction. Use the actual material grade and relevant directional properties.
- Screen deformation. The simple shear estimate γ ≈ Δu/t relates relative movement to bond thickness. It is not a stress prediction or an acceptance limit.
- Review the real joint. Constraints, thickness variation, substrate bending and edge peel can change local loading. Review all interfaces, including the polarizer laminate.
Apply the distinction
Increasing bond thickness changes the simple strain screen. Does that prove the display will survive? No. The screen does not establish actual stress, adhesion, fatigue or optical performance. Validate the selected stack, mounting, process and exposure against defined criteria.
See slides 24–29 and the CTE reading in this chapter. The Optical Bonding course provides the fuller treatment.
Cold LCD response and dynamic readability
At low temperatures, increased liquid-crystal viscosity slows optical switching. A static image can be legible while moving dials, indicators, scrolling text and maps smear or trail, obscuring information. Slower optical transitions are different from a slow data update, a frozen video frame or a low refresh rate, although all can impair dynamic readability.
Test cold startup and stabilized operation using representative motion, transition speeds and critical gray-to-gray changes. Define how quickly information must become readable and how long degradation is permitted. A usable-image startup limit alone does not establish acceptable moving-image performance.
Suitable LC materials, controlled heating and drive compensation can improve cold performance. Verify warm-up time, energy demand, temperature uniformity, heater control and the completed assembly. Evaluate hot contrast and cold response separately; survival, powered operation and usable dynamic performance are distinct claims.
Sources: Diggy Breiling's display-integration input; Focus LCDs temperature guidance; Tianma low-temperature display technology. Accessed 21 October 2026.
Engineering application and worked evidence
The following examples develop the display mechanisms and evidence decisions. Numerical values are teaching assumptions, not universal DO-160 limits. Use the adopted procedure for exact test conditions and the product requirements for functional acceptance.
A display has several temperatures
A chamber setpoint is the target air temperature. Verify the measured air temperature near the equipment. A controller setting or chamber-wall measurement alone does not establish the exposure, and neither tells us the temperature of every part of the display. The backlight, power converter and transparent heater generate heat. The enclosure and mount conduct it away, and the optical stack can absorb sunlight. Place sensors where the requirement and the suspected failure mechanism demand them, while checking that the sensors do not disturb the optics or heat path. Record the temperatures with operating mode and input power. A claim for operation at a stated ambient temperature needs evidence that the internal parts remain within the limits adopted for the enhanced assembly.
Basis: RTCA DO-160G, Section 4. Retained reference in 80 Reference Library/Aerospace. Display mechanisms, design responses and worked cases are FPD.DEV engineering teaching synthesis, not additional DO-160 requirements. Numerical examples are illustrative.
Hot Contrast: a worked comparison
Here is an illustrative Hot Contrast comparison at a panel temperature of seventy degrees Celsius and fifty thousand lux at the display surface. All luminance values are measured in the observer direction with that ambient illumination present. These are total measured luminances, so we do not add ambient reflection again. Before enhancement, white is eight hundred and black is two hundred candelas per square metre, so contrast is four to one. After reducing reflections, white is seven hundred and twenty and black is one hundred and twenty, giving six to one. White luminance decreased, yet ambient contrast improved. These invented values explain the calculation. The actual test must define illumination geometry, spectrum, viewing direction and instrument uncertainty, then measure the real display.
| Illustrative state | White / black (cd/m²) | Ambient contrast |
|---|---|---|
| Before enhancement | 800 / 200 | 4:1 |
| After enhancement | 720 / 120 | 6:1 |
Basis: RTCA DO-160G, Section 4; NIST display daylight ambient contrast measurement methods. Retained reference in 80 Reference Library/Aerospace. Display mechanisms, design responses and worked cases are FPD.DEV engineering teaching synthesis, not additional DO-160 requirements. Numerical examples are illustrative.
Cold motion and heater control
A cold display can show a sharp stationary image while a moving pointer leaves a trail. Low temperature slows the liquid crystal optical response, so a fast video interface does not guarantee a fast visible transition. Exercise representative grey transitions and the actual symbols at the intended update rate. Record warm-up time, smear and overshoot, including any drive compensation. A transparent heater can extend the usable ambient range, but the control system needs temperature sensing, power budgeting and protection against overheating. Check a failed sensor or stuck heater command against the product safety requirements. The useful result is a demonstrated operating envelope for the complete heated display.
Basis: RTCA DO-160G, Sections 4 and 16; Tianma low-temperature response technical material. Retained reference in 80 Reference Library/Aerospace. Display mechanisms, design responses and worked cases are FPD.DEV engineering teaching synthesis, not additional DO-160 requirements. Numerical examples are illustrative.
Practice: Hot Contrast and cold motion
A display measures 900 cd/m² white and 180 cd/m² black under a specified bright ambient exposure at its hot operating condition. A filter changes the readings to 760 and 120. Calculate both ratios. Then write a separate cold-motion acceptance record for a scrolling map.
Model response and review points
The ratios are 5.0:1 and about 6.33:1. The filtered state has lower white luminance and better measured ambient contrast in this example. Compare both with the actual minimum luminance and contrast requirements. Record panel and ambient temperature, incident illumination and spectrum, geometry, viewing direction and uncertainty. For cold motion, define the displayed pattern, update rate, grey transitions, allowed blur or response time, warm-up allowance and LCD temperature. A stationary image or nominal frame rate alone does not close that requirement.
Page 6: Temperature procedures, variation and thermal lag
Temperature and altitude procedures
DO-160 Display Qualification | A-P13 — Development edition
Learning objective: Separate conditioning, stabilization, exposure and functional evidence in Section 4.
Translate the matrix into stages
A temperature procedure needs a chronological sequence and an acceptance matrix. Label unpowered survival, short-time operation and normal operation separately. For each stage specify chamber setpoint, tolerance from the adopted method, power state, required stabilization basis, timing origin, minimum duration, functions and measurements. Time spent approaching a setpoint does not automatically count as stabilized exposure.
In DO-160G the low/high operating tests include at least two hours of operation after equipment temperature stabilization; ground-survival conditions include at least three hours after stabilization. Applicable short-time operation is at least 30 minutes with its prescribed preceding conditioning. Use §§4.5.1–4.5.4 and the full profile to place these intervals correctly. Do not assemble a new sequence merely by joining the three durations.
Instrument the actual boundary
Chamber air, enclosure, LCD glass, backlight heat spreader and processor can have different temperatures. Choose thermocouple points that support the required stabilization and the allocated component limits. Do not let sensors or instrumentation wires alter a seal, cooling path or EMI arrangement without assessing their influence. Preserve raw temperature histories along with summarized dwell times.
Representative heat and cooling
Use installed mounting conduction, airflow and specified cooling interfaces. Establish modes that challenge the thermal design: maximum backlight, high graphics load, heater startup and combinations permitted by the design. A thermostatic heater may dominate a cold startup; a dim mode can still stress processing electronics. Loss-of-cooling subtests apply where required by the selected category and architecture; they are not assumed for every passively cooled display.
Worked discrepancy
The chamber reaches +70 °C at 09:00. The defined equipment stabilization condition is reached at 09:40. The log stops normal high-temperature operation at 11:00. Only 80 minutes follow stabilization, so this record does not demonstrate a two-hour post-stabilization requirement. Investigate the actual method, then extend or repeat as dispositioned. Do not relabel chamber arrival as equipment stabilization.
Procedure output
Prepare a stage table with columns for source paragraph, target, power, stabilization, start trigger, duration, measured functions and stop conditions. At altitude, include absolute pressure and pressure history. Section 4.6.1 requires at least two hours after stabilization, or the duty cycle if longer, under its specified conditions. Check combined temperature/altitude requirements explicitly rather than assuming an ambient-altitude test represents the hottest installation.
Temperature variation and thermal lag
DO-160 Display Qualification | A-P13 — Development edition
Learning objective: Specify ramp evidence and diagnose thermal lag without substituting a different method.
What the ramp rate describes
DO-160G Section 5 Categories A, B and C use minimum chamber temperature-change rates of 10, 5 and 2 °C/min respectively. The category designation belongs to Section 5; it is not the Section 4 temperature category. S1/S2 temperature-shock categories address changes greater than 10 °C/min using their own procedures and distinctions. Read the exact adopted definitions and tolerances.
The A/B/C procedure includes at least two cycles and more if needed to complete the required performance checks. The endpoints, stabilization, powered transitions and prescribed power-off/restart stages matter as much as the nominal slope. A purchasing sentence that specifies only ten cycles at 10 °C/min is incomplete.
Thermal lag and failure mechanisms
The panel does not necessarily follow chamber air at the same rate. Mass, enclosure conduction, heater control and airflow affect its response. Differential expansion can stress the optical bond, cover glass, panel supports, flex tails and solder joints. A chamber that changes quickly while the assembly barely changes may still follow a defined chamber-based method, but its actual traces are needed to interpret development evidence and any additional component requirement.
Look for image nonuniformity, bubbles or edge separation, touch drift, intermittent connectors and new contamination. Use reference photographs and numeric criteria at repeatable conditions. Distinguish reversible cold response from lasting damage, while still applying any during-exposure requirement.
Exercise: apparent equivalent cycles
Supplier A reports 100 slow cycles at 1 °C/min. Supplier B reports the required Category B sequence at 5 °C/min. Does A's larger cycle count establish the same qualification? Worked response: no. It can be useful development or durability evidence, but rate, endpoints, power state, stabilization and the required functional checks must be compared. More cycles do not automatically cover a different thermal-gradient exposure.
Record checklist
Save chamber and selected equipment temperature traces, actual transition rates, cycle markers, power events, functional data and anomalies. State rate calculation intervals and the method used to determine stabilization. Review the profile before issuing a pass so insufficient transitions or missing restart checks can be dispositioned while the setup remains available.
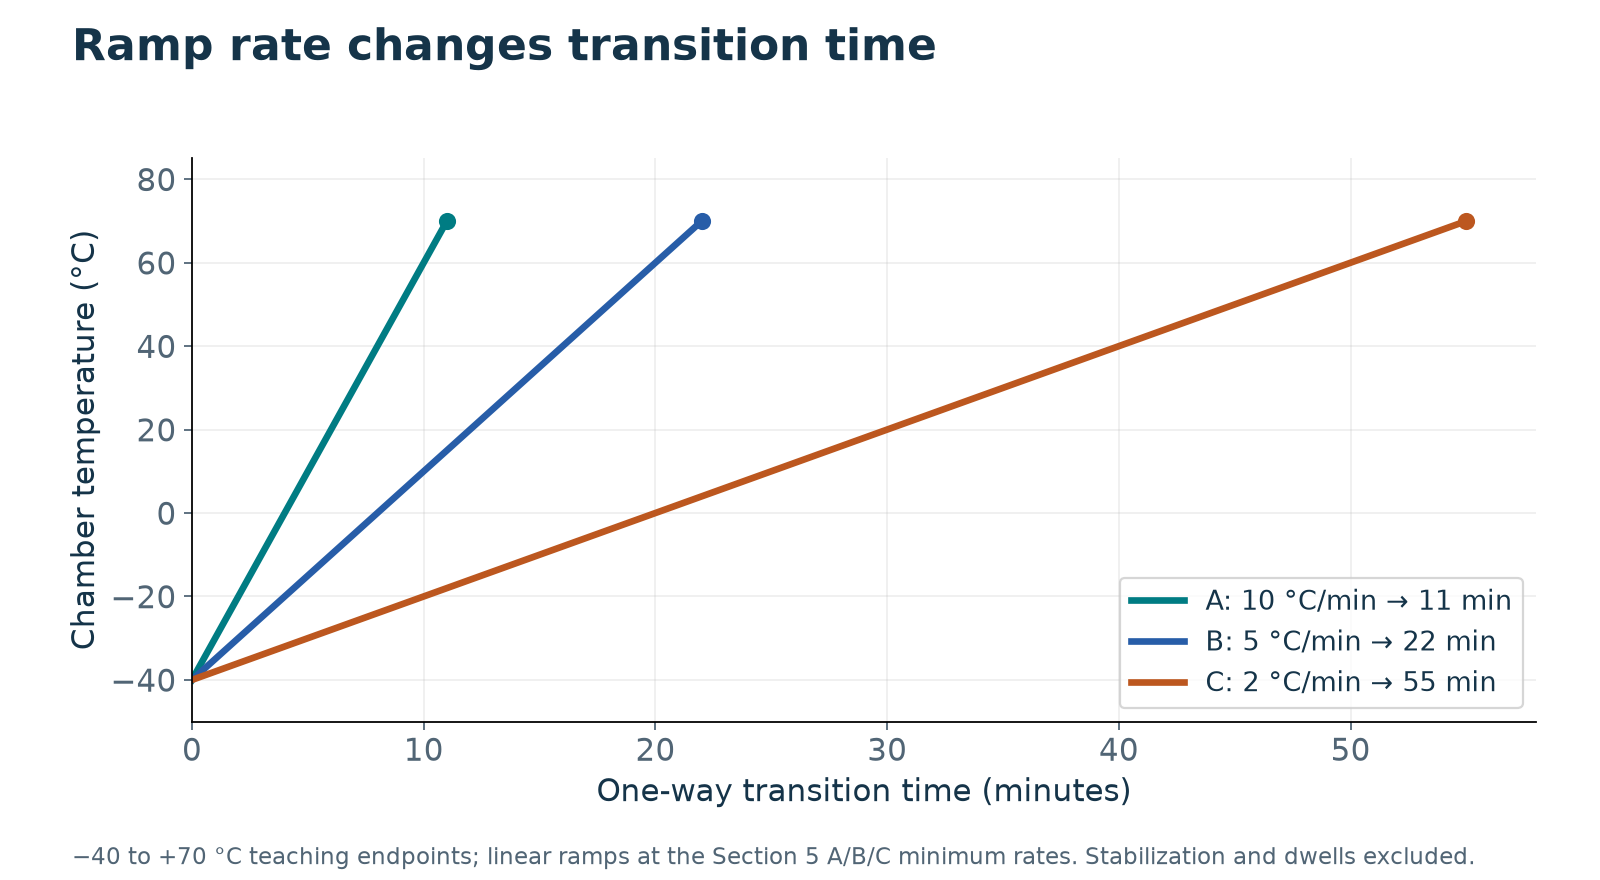
Section 5 rates and the selected transition example
| Category | Rate designation | −40 to +70 °C example |
|---|---|---|
| A | ≥10 °C/min | 11 min at exactly 10 °C/min |
| B | ≥5 °C/min | 22 min at exactly 5 °C/min |
| C | ≥2 °C/min | 55 min at exactly 2 °C/min |
| S1 | Known rate >10 °C/min | Use the separate thermal-shock procedure; record rate |
| S2 | Unknown rate >10 °C/min | Use the separate thermal-shock procedure |
At ambient stabilization, perform the required compliance checks in the second or last cycle as applicable. Monitoring during transitions, any additional cycles, condensation control and permitted inter-cycle breaks must follow §5.3.1. This sequence is not a combined Section 4/5 procedure.
Page takeaway
- Draft one temperature stage table with a clear stabilization basis and timer trigger.
- Record rate, endpoints, power sequence, cycle count and performance checks as separate requirements.
Supporting page images
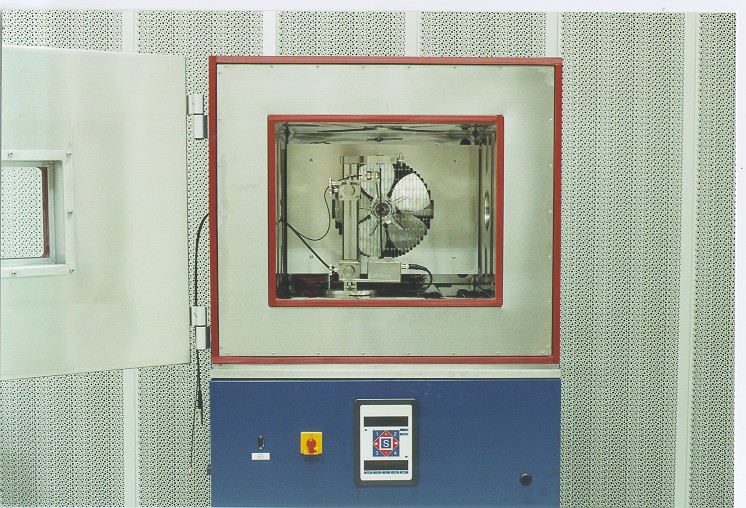
Photo: Cjp24 · Environmental chamber-open · CC BY-SA 3.0. Original image, displayed at reduced size.

Engineering application and worked evidence
The following examples develop the display mechanisms and evidence decisions. Numerical values are teaching assumptions, not universal DO-160 limits. Use the adopted procedure for exact test conditions and the product requirements for functional acceptance.
Thermal lag changes the exposure
During a rapid chamber transition, the cover glass, LCD frame, bondline and housing do not change temperature at the same rate. Their transient mismatch can differ from the mismatch after equilibrium. A large metal fixture can also delay the response or provide an unintended heat sink. Use the stabilization definition and transition requirements in the adopted procedure, and record representative item temperatures as supporting evidence. Do not replace the prescribed exposure with an arbitrary wait until one convenient sensor settles. During development, instrument several locations to learn which gradient coincides with a contrast change, bond-edge defect or loss of touch accuracy.
Basis: RTCA DO-160G, Sections 4 and 5. Retained reference in 80 Reference Library/Aerospace. Display mechanisms, design responses and worked cases are FPD.DEV engineering teaching synthesis, not additional DO-160 requirements. Numerical examples are illustrative.
Temperature evidence before and after
The display returns to room temperature and looks normal. That establishes recovery, but it does not erase a loss of function while hot or cold. Prepare the baseline using controlled patterns, brightness settings and measurement geometry. During the test, collect the signals needed to judge the required operating behaviour. After the specified recovery, repeat the baseline and inspect for permanent changes. A reversible contrast collapse, a temporary link reset and a permanent bond defect are different observations with different acceptance consequences. Tie each observation to the actual requirement. Preserve the time history so a later reviewer can distinguish an exposure failure from an instrument interruption.
Basis: RTCA DO-160G, Sections 3, 4 and 5. Retained reference in 80 Reference Library/Aerospace. Display mechanisms, design responses and worked cases are FPD.DEV engineering teaching synthesis, not additional DO-160 requirements. Numerical examples are illustrative.
Practice: A recovered image with a transient failure
During a temperature transition, the image loses contrast for two seconds, then fully recovers. The post-test photographs look normal. What evidence and decision are still needed?
Model response and review points
Retain the synchronized exposure, panel temperature and image record. Check the adopted operating state and the product criterion for behaviour during the transition. Full recovery supports the recovery criterion but does not erase a during-test failure. Distinguish the observed event from its proposed mechanism. Investigate thermal gradients, drive conditions and monitoring artefacts, then disposition the anomaly and affected retest scope.
Page 7: Pressure, altitude and decompression
Pressure, altitude and decompression
DO-160 Display Qualification | A-P13 — Development edition
Learning objective: Define pressure requirements and distinguish decompression from explosion proofness.
Pressure is a separate axis of exposure
An altitude test represents reduced ambient pressure. It can affect cooling, dielectric behavior, trapped cavities, seals and bonded optical assemblies. Specify pressure as absolute pressure with the equivalent altitude and the adopted conversion basis. A gauge pressure number without its reference is ambiguous.
DO-160G §4.6.2 starts at the equivalent of 8,000 ft, reduces pressure to the aircraft maximum operational altitude within 15 seconds, and holds the condition for at least ten minutes or the equipment-specification duration, with the equipment operating as prescribed. The procedure is at ambient temperature. This is not a universal requirement to reach 65,000 ft. A customer may specify that final altitude or a much faster transition, but must identify it as an explicit requirement with a complete profile.
Section 9 explosion proofness concerns ignition in a flammable atmosphere. The term explosive decompression does not make Section 9 the applicable pressure method. Avoid informal terminology in a contract when it could send the laboratory to the wrong test.
Pressure history worksheet
Record initial absolute pressure, final absolute pressure, transition measurement points and timing definition, hold duration, temperature, operating mode, instrumentation and acceptance criteria. Include permissible pressure overshoot only as allowed by the adopted procedure or agreed deviation. Ask the laboratory to demonstrate that its chamber can meet the profile with the actual article volume and venting arrangement.
Display observations
Monitor image continuity and backlight behavior during the transient, then check touch and optical condition. Inspect trapped-air regions, bond edges, covers and enclosure seals. A cosmetic bubble can also distort symbols or grow into a structural concern; define permitted defects and functional limits before exposure.
Exercise
Two reports both state 55,000 ft. One is a stabilized altitude soak and the other includes a qualifying rapid pressure transition. Are they interchangeable? Worked response: no. The transient pressure differential and the steady low-pressure environment can challenge different mechanisms. Review each allocated subtest and its acceptance state. An endpoint alone is not a pressure test profile.
For context, DO-160G Table 4-2 gives approximately 75.26 kPa absolute at 8,000 ft and 9.12 kPa at 55,000 ft. Use the adopted table and specified tolerance for the actual procedure; do not use these rounded teaching values as chamber calibration instructions.
Three pressure tests answer different questions
| Test | Pressure target | State and timing |
|---|---|---|
| Altitude — §4.6.1 | Selected equipment altitude/category | Ambient temperature; maximum duty cycle; stabilize equipment, then ≥2 h or longer duty cycle as applicable |
| Decompression — §4.6.2 | 8,000 ft equivalent → aircraft maximum operational altitude | Ambient temperature; operating; stabilize initially; reduction within 15 s; final hold ≥10 min or as specified |
| Overpressure — §4.6.3 | 170 kPa absolute (−15,000 ft equivalent) | Normally unpowered unless specified otherwise; ≥10 min; return to ambient pressure and evaluate |
Trapped gas and adhesive systems
Falling external pressure can make trapped gas expand and drive flow through available paths. Restricted equalization produces a pressure difference across a cavity, film or bonded interface. A compliant pocket can enlarge; a stiff sealed cavity may instead sustain pressure with little volume change. Rate matters: a cavity that equalizes during a slow altitude change may respond differently during rapid decompression.
For a fixed gas quantity at constant absolute temperature and free equilibrium expansion, p₁V₁ = p₂V₂. Halving absolute pressure doubles volume. This teaching model does not predict an actual constrained void, where material stiffness, adhesion, surface forces, leakage, temperature and transient flow also matter. Outgassing performance alone does not establish resistance to pressure-driven damage.
Expansion can impose peel or opening loads. If local resistance is exceeded, adhesive failure separates an interface, while cohesive failure tears a material internally. The adjacent film, coating or glass can also fail. Inspect both fracture surfaces and document mixed failure modes. An intact electrical image does not prove that every adhesive layer remains sound.
Review optical bonding silicones and adhesive films, EMI tapes, bonded or adhesive-backed gasketing, sealants, and potting/encapsulation compounds. This is a review scope for all adhesive families, not a statement that every material or assembly will fail. Mechanically retained gaskets still need seal and cavity-pressure assessment. Consider voids, wetting, cure, vent paths, permeability, geometry and decompression rate. Control degassing and application as required by the selected process, and verify representative assemblies under the actual required pressure profile. Inspect optical bubbles, edge lift, separation and relevant sealing/electrical functions.
Page takeaway
- Specify absolute pressures, transition, hold and acceptance. Distinguish altitude, decompression and explosion proofness.
Supporting page images
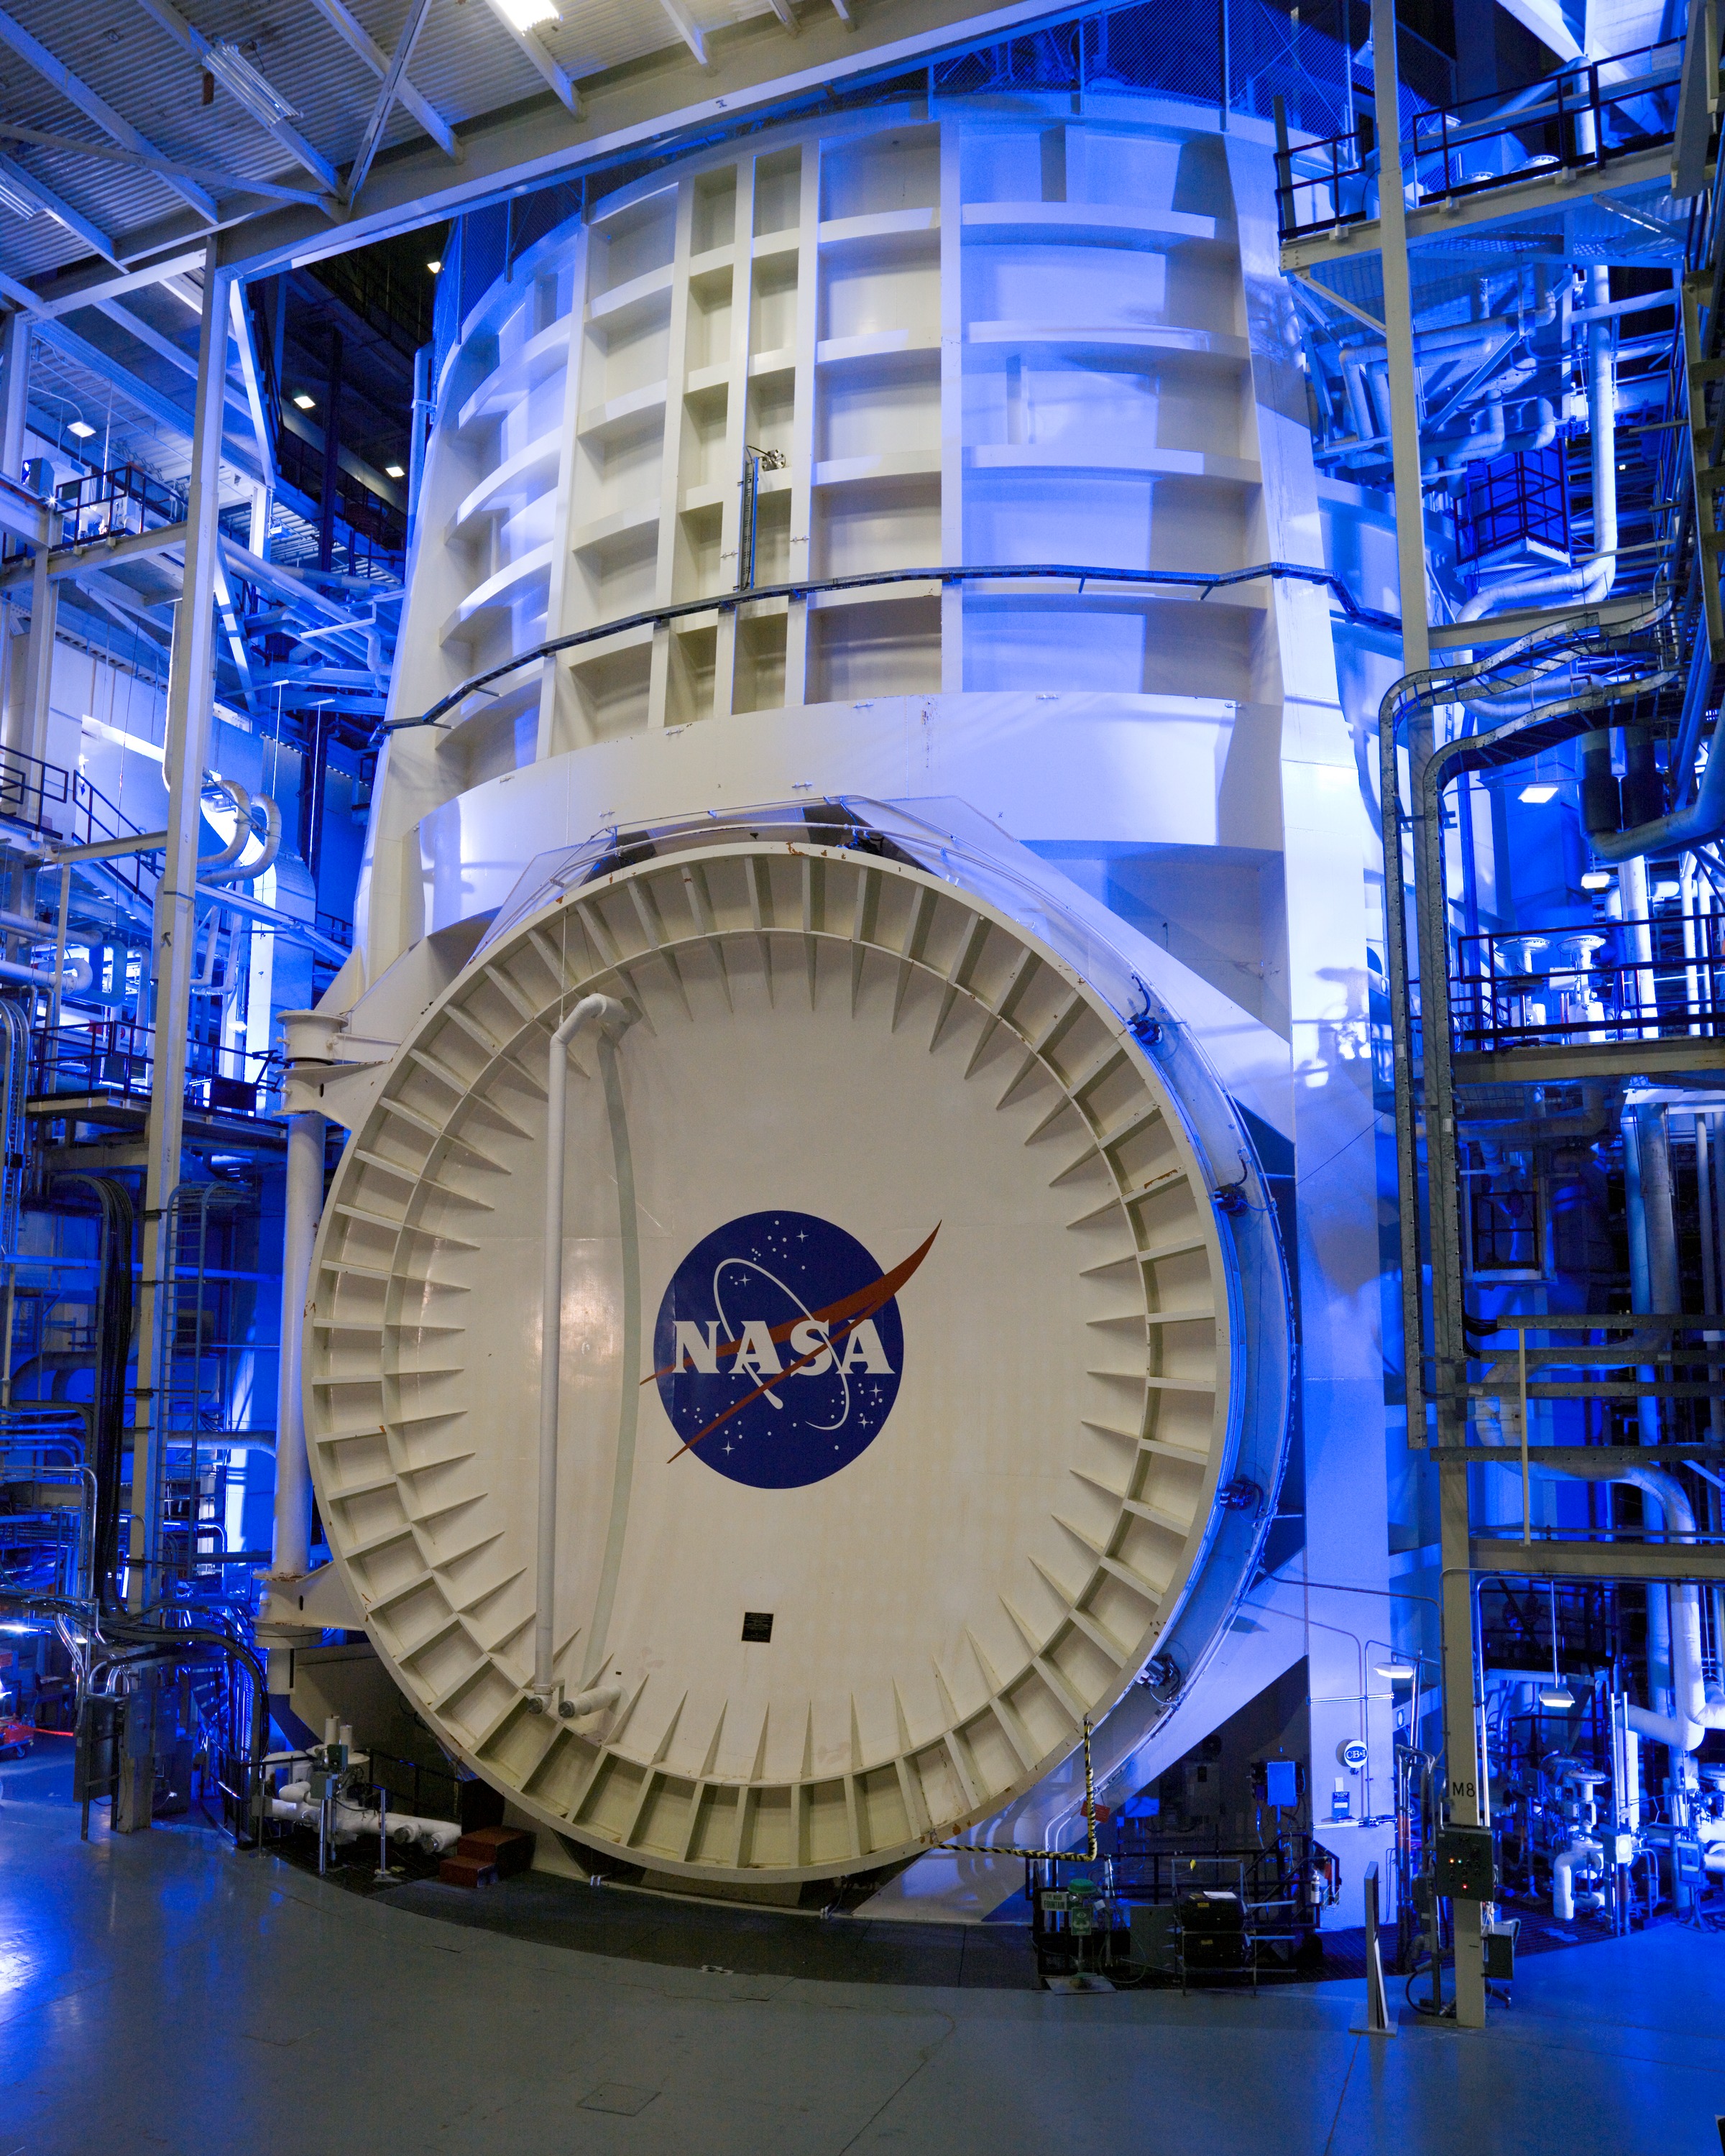
Photo: NASA Johnson Space Center · Thermal Vacuum Test Chamber A with Door Closed · Public domain in the United States. Original image, displayed at reduced size.

Engineering application and worked evidence
The following examples develop the display mechanisms and evidence decisions. Numerical values are teaching assumptions, not universal DO-160 limits. Use the adopted procedure for exact test conditions and the product requirements for functional acceptance.
Pressure difference loads the window
Consider a sealed window with an exposed area of two hundred by one hundred and fifty millimetres. Its area is zero point zero three square metres. An illustrative pressure difference of twenty kilopascals creates a resultant force of six hundred newtons, using force equals pressure difference times area. This is a net load, not a prediction of glass stress or bond-edge stress. Those depend on geometry, support, stiffness and the changing internal pressure. A vent changes the pressure history, and its flow capacity matters during decompression. Use the real installation and selected pressure profile to establish loads before assessing deflection, clearances and attachment strength.
| Quantity | Illustrative value | Meaning |
|---|---|---|
| Window area | 0.200 m × 0.150 m | 0.030 m² |
| Pressure difference | 20,000 Pa | Internal minus external |
| Resultant force | 20,000 × 0.030 | 600 N |
Basis: RTCA DO-160G, Section 4. Retained reference in 80 Reference Library/Aerospace. Display mechanisms, design responses and worked cases are FPD.DEV engineering teaching synthesis, not additional DO-160 requirements. Numerical examples are illustrative.
Vents, seals and pressure monitoring
A vented enclosure can still develop a pressure difference when outside pressure changes faster than air can pass through the vent. Measure internal and external pressure with enough time resolution to capture the transient, and document the tubing and sensors because they can alter the volume or flow path. Include the actual membrane, filter and mounting arrangement. A moisture-resistant vent also creates design trade-offs in ingress protection and pressure equalization. Look for window movement, trapped-bubble growth and changes in sealing after exposure. A successful slow altitude dwell does not by itself demonstrate behaviour during the specified decompression transient.
Basis: RTCA DO-160G, Sections 4 and 10. Retained reference in 80 Reference Library/Aerospace. Display mechanisms, design responses and worked cases are FPD.DEV engineering teaching synthesis, not additional DO-160 requirements. Numerical examples are illustrative.
Practice: A vented housing during decompression
A vented enclosure has no significant pressure difference after a slow dwell. The designer proposes omitting transient internal-pressure monitoring. Assess the proposal and identify the load evidence.
Model response and review points
A slow dwell does not establish the pressure difference during a rapid external change. Assess vent flow, internal volume and the required pressure-time profile. Measure or otherwise substantiate the transient internal and external pressures without materially changing the vent path. Calculate resultant loads from pressure difference and exposed area, then evaluate stress and deflection using the real support. Record the installed membrane, filter, sealing and cable-entry configuration.
References and sources
- Master Bond, Bonding Substrates with Different Thermal Expansion Coefficients: Thermal mismatch
- 3M, Structural Adhesives FAQs: Temperature-dependent properties and failure location
- NASA, Space Shuttle Return To Flight Gets A LIFT From NASA Dryden F-15B; mechanism example, not display qualification evidence: Trapped gas expansion and adhesive damage
- DAEIL Systems, Active vs. Passive Vibration Isolation; general mechanics, not an aircraft mount selection: Passive isolation and resonance
- CDTech, Mura and Luminance Uniformity: Causes, Detection and Acceptance: LCD mounting stress and cell gap
- Focus LCDs: Temperature Consideration for Displays
- Tianma: SLT-Super Low Temperature Technology
- www.rtca.org: RTCA DO-160 publications and supporting material
This course is a living document. Enrolled learners typically receive updates when chapters are revised. Use your project’s adopted standards and qualification baseline.
There are no comments for now.
to be the first to leave a comment.